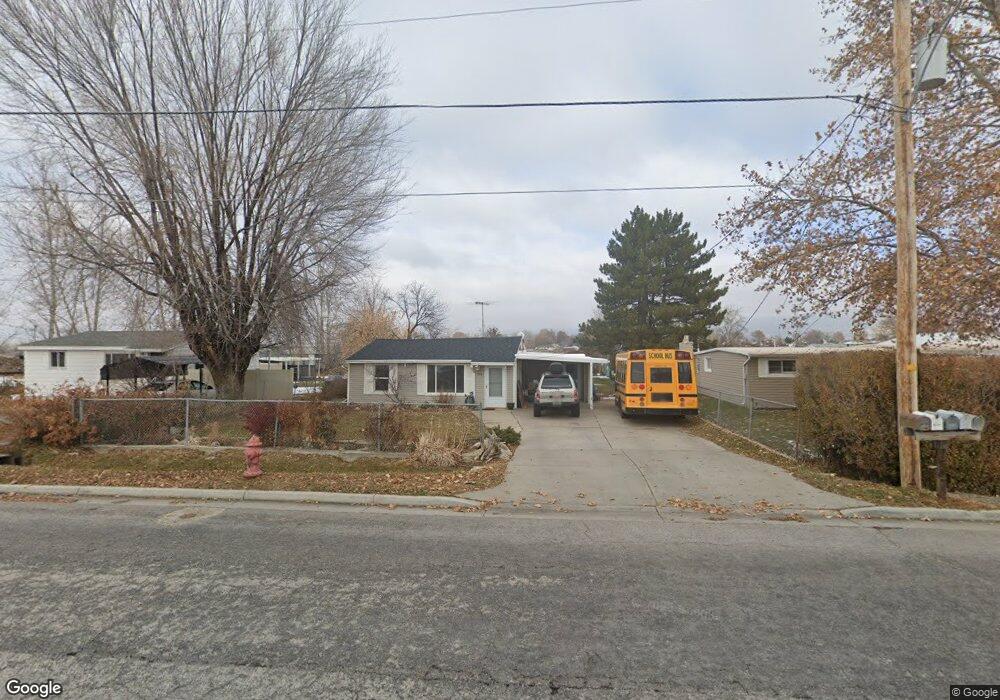
298 N Century Dr Ogden, UT 84404
Lynn NeighborhoodEstimated Value: $481,000 - $508,000
4
Beds
2
Baths
2,124
Sq Ft
$231/Sq Ft
Est. Value
About This Home
This home is located at 298 N Century Dr, Ogden, UT 84404 and is currently estimated at $490,164, approximately $230 per square foot. 298 N Century Dr is a home located in Weber County with nearby schools including Heritage Elementary School, Highland Junior High School, and Ben Lomond High School.
Ownership History
Date
Name
Owned For
Owner Type
Purchase Details
Closed on
Mar 12, 2008
Sold by
Hanrion Mark A
Bought by
Hanrion Mark A
Current Estimated Value
Home Financials for this Owner
Home Financials are based on the most recent Mortgage that was taken out on this home.
Original Mortgage
$199,599
Interest Rate
5.65%
Mortgage Type
New Conventional
Purchase Details
Closed on
Sep 26, 2005
Sold by
Heritage Homes Inc
Bought by
Hanrion Mark A
Home Financials for this Owner
Home Financials are based on the most recent Mortgage that was taken out on this home.
Original Mortgage
$21,000
Interest Rate
5.33%
Mortgage Type
Stand Alone Second
Purchase Details
Closed on
Apr 25, 2005
Sold by
Lumbermens Investment Corp
Bought by
Heritage Homes Inc and Sierra Homes Construction Inc
Home Financials for this Owner
Home Financials are based on the most recent Mortgage that was taken out on this home.
Original Mortgage
$130,800
Interest Rate
5.92%
Mortgage Type
Purchase Money Mortgage
Create a Home Valuation Report for This Property
The Home Valuation Report is an in-depth analysis detailing your home's value as well as a comparison with similar homes in the area
Home Values in the Area
Average Home Value in this Area
Purchase History
| Date | Buyer | Sale Price | Title Company |
|---|---|---|---|
| Hanrion Mark A | -- | Atlas Title Salt Lake | |
| Hanrion Mark A | -- | American Secure Title | |
| Hanrion Mark A | -- | American Secure Title | |
| Heritage Homes Inc | -- | Mountain View Title Ogden |
Source: Public Records
Mortgage History
| Date | Status | Borrower | Loan Amount |
|---|---|---|---|
| Open | Hanrion Mark A | $199,599 | |
| Closed | Hanrion Mark A | $21,000 | |
| Closed | Hanrion Mark A | $135,860 | |
| Previous Owner | Heritage Homes Inc | $130,800 |
Source: Public Records
Tax History Compared to Growth
Tax History
| Year | Tax Paid | Tax Assessment Tax Assessment Total Assessment is a certain percentage of the fair market value that is determined by local assessors to be the total taxable value of land and additions on the property. | Land | Improvement |
|---|---|---|---|---|
| 2025 | $711 | $471,181 | $130,000 | $341,181 |
| 2024 | $711 | $258,499 | $71,503 | $186,996 |
| 2023 | $616 | $240,900 | $68,606 | $172,294 |
| 2022 | $1,497 | $233,200 | $52,252 | $180,948 |
| 2021 | $992 | $332,000 | $70,012 | $261,988 |
| 2020 | $819 | $298,000 | $55,035 | $242,965 |
| 2019 | $583 | $261,000 | $44,984 | $216,016 |
| 2018 | $487 | $245,000 | $44,984 | $200,016 |
| 2017 | $284 | $216,000 | $40,086 | $175,914 |
| 2016 | $61 | $104,797 | $21,446 | $83,351 |
| 2015 | $70 | $104,797 | $21,446 | $83,351 |
| 2014 | $100 | $104,797 | $18,768 | $86,029 |
Source: Public Records
Map
Nearby Homes
- 352 N Sam Gates Rd
- 101 S Century Dr Unit 101
- 5332 S Century Way W Unit 111
- 305 N Wall Ave
- 142 W 2nd St
- 360 N Wall Ave
- 152 W 2nd St
- 197 W 2nd St
- 117 North St
- 151 E Southwell St Unit 9
- 382 W Oaks Dr Unit W
- 449 Downs Dr
- 511 E Douglas St
- 333 Childs Ave Unit 16C
- 200 N Harrisville Rd Unit 44
- 200 N Harrisville Rd Unit 8
- 244 W Downs Cir
- 636 Downs Dr
- 265 E Larsen Ln
- 1636 Washington Blvd
- 308 N Century Dr
- 281 N Erastus Dr
- 314 N Century Dr
- 287 N Erastus Dr
- 305 Stone Pond Rd
- 432 Stone Pond Rd
- 409 Stone Pond Rd
- 291 N Erastus Dr
- 419 Stone Pond Rd
- 322 N Century Dr
- 315 N Century Dr
- 270 N Century Dr
- 437 Stone Pond Rd
- 323 N Century Dr
- 438 Stone Pond Rd
- 251 N Erastus Dr
- 297 N Erastus Dr
- 260 N Century Dr
- 443 Stone Pond Rd
- 282 N Erastus Dr