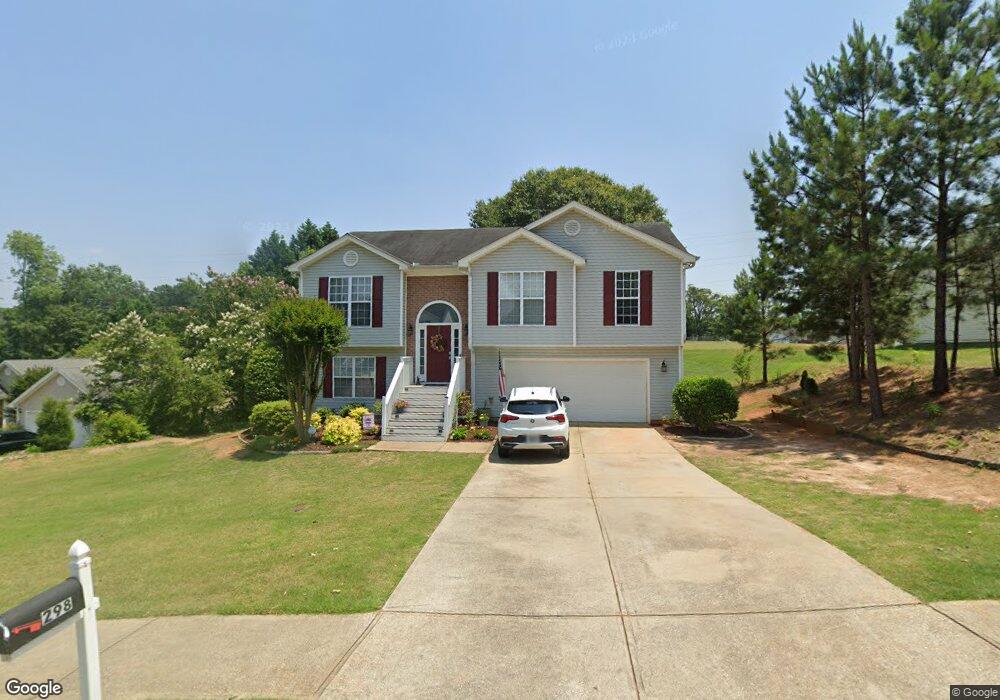
298 Natchez Cir Unit 2 Winder, GA 30680
Estimated Value: $351,000 - $362,000
4
Beds
3
Baths
2,054
Sq Ft
$174/Sq Ft
Est. Value
About This Home
This home is located at 298 Natchez Cir Unit 2, Winder, GA 30680 and is currently estimated at $356,797, approximately $173 per square foot. 298 Natchez Cir Unit 2 is a home located in Barrow County with nearby schools including County Line Elementary School, Russell Middle School, and Winder-Barrow High School.
Ownership History
Date
Name
Owned For
Owner Type
Purchase Details
Closed on
Oct 29, 2018
Sold by
Mills Wanda Faye
Bought by
Powers Shannon D and Deslauries James E
Current Estimated Value
Home Financials for this Owner
Home Financials are based on the most recent Mortgage that was taken out on this home.
Original Mortgage
$181,649
Outstanding Balance
$159,561
Interest Rate
4.75%
Mortgage Type
FHA
Estimated Equity
$197,236
Purchase Details
Closed on
Sep 13, 2002
Sold by
Star Home Builders
Bought by
Mills Wanda F
Home Financials for this Owner
Home Financials are based on the most recent Mortgage that was taken out on this home.
Original Mortgage
$137,735
Interest Rate
6.3%
Mortgage Type
FHA
Purchase Details
Closed on
Feb 22, 2002
Sold by
Dogwood Enterprises
Bought by
Star Home Builders I
Purchase Details
Closed on
Aug 6, 1998
Bought by
Dogwood Enterprises
Create a Home Valuation Report for This Property
The Home Valuation Report is an in-depth analysis detailing your home's value as well as a comparison with similar homes in the area
Home Values in the Area
Average Home Value in this Area
Purchase History
| Date | Buyer | Sale Price | Title Company |
|---|---|---|---|
| Powers Shannon D | $185,000 | -- | |
| Mills Wanda F | $140,000 | -- | |
| Star Home Builders I | $330,000 | -- | |
| Dogwood Enterprises | -- | -- |
Source: Public Records
Mortgage History
| Date | Status | Borrower | Loan Amount |
|---|---|---|---|
| Open | Powers Shannon D | $181,649 | |
| Previous Owner | Mills Wanda F | $137,735 |
Source: Public Records
Tax History Compared to Growth
Tax History
| Year | Tax Paid | Tax Assessment Tax Assessment Total Assessment is a certain percentage of the fair market value that is determined by local assessors to be the total taxable value of land and additions on the property. | Land | Improvement |
|---|---|---|---|---|
| 2024 | $3,467 | $122,851 | $27,200 | $95,651 |
| 2023 | $4,062 | $122,851 | $27,200 | $95,651 |
| 2022 | $3,219 | $94,994 | $22,800 | $72,194 |
| 2021 | $2,753 | $75,827 | $16,000 | $59,827 |
| 2020 | $2,537 | $73,450 | $16,000 | $57,450 |
| 2019 | $2,504 | $71,393 | $13,600 | $57,793 |
| 2018 | $2,151 | $60,851 | $13,600 | $47,251 |
| 2017 | $1,550 | $51,958 | $13,600 | $38,358 |
| 2016 | $1,495 | $48,343 | $13,600 | $34,743 |
| 2015 | $1,510 | $48,733 | $13,600 | $35,133 |
| 2014 | $1,276 | $42,384 | $6,860 | $35,524 |
| 2013 | -- | $40,140 | $6,860 | $33,280 |
Source: Public Records
Map
Nearby Homes
- 292 Natchez Cir
- 418 Jasmine Dr
- 244 Bayou Ln Unit 1
- 486 Jasmine Dr
- 49 Cannondale Dr
- 98 Cannondale Dr
- 62 Garrison Dr
- 74 Cannon Trace Dr
- 66 Garrison Dr
- 72 Garrison Dr
- Cary C Plan at Lake Shore
- Marion A Plan at Lake Shore
- Cary A Plan at Lake Shore
- 94 Garrison Dr
- 18 Steelwood Ct
- 295 Cedar Wood Trace
- 276 Cedar Wood Trace
- 273 Cedar Wood Trace
- 264 Cedar Wood Trace
- 719 Overlook Dr
- 298 Natchez Cir Unit .
- 298 Natchez Cir
- 300 Natchez Cir Unit 21
- 300 Natchez Cir Unit 2
- 300 Natchez Cir
- 296 Natchez Cir Unit 23
- 296 Natchez Cir
- 296 Natchez Cir Unit 2
- 299 Natchez Cir
- 295 Natchez Cir Unit 2
- 294 Natchez Cir Unit 2
- 302 Natchez Cir Unit 1
- 302 Natchez Cir
- 301 Natchez Cir Unit 2
- 301 Natchez Cir
- 453 Jasmine Dr
- 287 Natchez Cir Unit 2
- 290 Natchez Cir Unit 2
- 308 Natchez Cir
- 308 Natchez Cir Unit 1