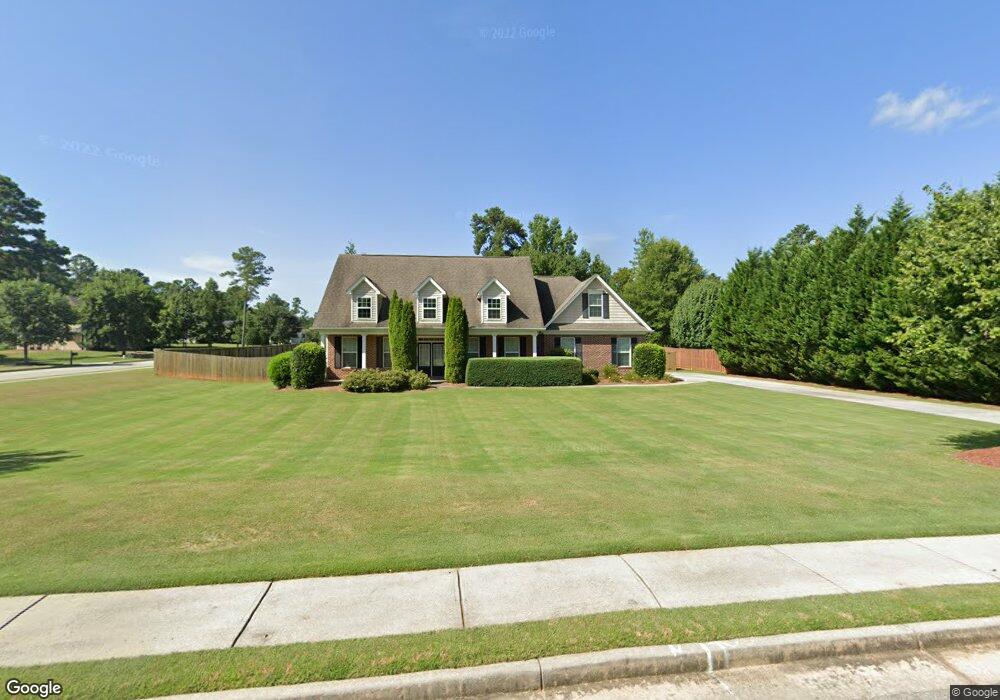
298 Silverbell Ln Sharpsburg, GA 30277
Estimated Value: $476,234 - $563,000
4
Beds
4
Baths
2,325
Sq Ft
$228/Sq Ft
Est. Value
About This Home
This home is located at 298 Silverbell Ln, Sharpsburg, GA 30277 and is currently estimated at $529,059, approximately $227 per square foot. 298 Silverbell Ln is a home located in Coweta County with nearby schools including Canongate Elementary School, Madras Middle School, and Northgate High School.
Ownership History
Date
Name
Owned For
Owner Type
Purchase Details
Closed on
May 1, 2017
Sold by
Devane Matthew B
Bought by
Devane Benjamin C
Current Estimated Value
Purchase Details
Closed on
May 29, 2009
Sold by
Gonzalez Luis E and Gonzalez Ruth N
Bought by
Devane Matthew B
Home Financials for this Owner
Home Financials are based on the most recent Mortgage that was taken out on this home.
Original Mortgage
$204,000
Interest Rate
4.77%
Mortgage Type
New Conventional
Purchase Details
Closed on
May 2, 2006
Sold by
Beta Const Inc
Bought by
Gonzalez Luis E and Gonzalez Ruth N
Home Financials for this Owner
Home Financials are based on the most recent Mortgage that was taken out on this home.
Original Mortgage
$271,000
Interest Rate
6%
Mortgage Type
VA
Purchase Details
Closed on
Sep 15, 2005
Sold by
D Brent Llc
Bought by
Beta Construction Inc
Purchase Details
Closed on
Sep 25, 2003
Sold by
D Brent Llc
Bought by
D Brent Llc
Create a Home Valuation Report for This Property
The Home Valuation Report is an in-depth analysis detailing your home's value as well as a comparison with similar homes in the area
Home Values in the Area
Average Home Value in this Area
Purchase History
| Date | Buyer | Sale Price | Title Company |
|---|---|---|---|
| Devane Benjamin C | $317,500 | -- | |
| Devane Matthew B | $255,000 | -- | |
| Gonzalez Luis E | $271,000 | -- | |
| Beta Construction Inc | $1,113,000 | -- | |
| D Brent Llc | $5,000,000 | -- |
Source: Public Records
Mortgage History
| Date | Status | Borrower | Loan Amount |
|---|---|---|---|
| Previous Owner | Devane Matthew B | $204,000 | |
| Previous Owner | Gonzalez Luis E | $271,000 |
Source: Public Records
Tax History Compared to Growth
Tax History
| Year | Tax Paid | Tax Assessment Tax Assessment Total Assessment is a certain percentage of the fair market value that is determined by local assessors to be the total taxable value of land and additions on the property. | Land | Improvement |
|---|---|---|---|---|
| 2025 | $4,466 | $189,032 | $36,000 | $153,032 |
| 2024 | $4,487 | $193,294 | $36,000 | $157,294 |
| 2023 | $4,487 | $174,060 | $32,000 | $142,060 |
| 2022 | $3,812 | $154,748 | $32,000 | $122,748 |
| 2021 | $3,180 | $120,795 | $24,000 | $96,795 |
| 2020 | $3,201 | $120,795 | $24,000 | $96,795 |
| 2019 | $3,436 | $117,396 | $24,000 | $93,396 |
| 2018 | $3,442 | $117,396 | $24,000 | $93,396 |
| 2017 | $3,183 | $113,365 | $24,000 | $89,365 |
| 2016 | $2,952 | $106,646 | $24,000 | $82,646 |
| 2015 | $2,771 | $101,942 | $24,000 | $77,942 |
| 2014 | $2,618 | $97,239 | $24,000 | $73,239 |
Source: Public Records
Map
Nearby Homes
- 78 Rosebay Ln
- 32 Riverbirch Way
- 140 Palmetto Pines Rd
- 30 Joe Lee Dr
- 40 Joe Lee Dr
- 291 Cannongate Rd
- 35 Palmer Place
- 91 Goodlin Rd
- 594 Collinsworth Rd
- 518 Palmetto Tyrone Rd
- 9 Warrior Way
- 56 Hudgen Rd
- 575 Laurelwood Dr
- 500 Laurelwood Dr
- 110 Calypso Ct
- 131 Lincoln Rd
- 200 Chaparral Trace
- 0 Fischer Spur Rd Unit 10495301
- 212 Greensprings Ct Unit 2
- 27 Dorian Ct
- 310 Silverbell Ln
- 43 Rosebay Ln Unit 43
- 0 Rosebay Ln Unit LOT 99
- 0 Rosebay Ln Unit LOT 99 3152828
- 0 Rosebay Ln Unit LOT 92 3167645
- 0 Rosebay Ln Unit LOT 42 3250951
- 0 Rosebay Ln Unit LOT 46 3267126
- 0 Rosebay Ln Unit LOT 42 3267059
- 0 Rosebay Ln Unit 60 7158774
- 0 Rosebay Ln Unit 51 7242861
- 0 Rosebay Ln
- 0 Rosebay Ln Unit 7187690
- 0 Rosebay Ln Unit 8721846
- 0 Rosebay Ln Unit 3154192
- 0 Rosebay Ln Unit 3246621
- 0 Rosebay Ln Unit 3216558
- 0 Rosebay Ln Unit 7392166
- 0 Rosebay Ln Unit 51
- 0 Rosebay Ln Unit LOT 35
- 0 Rosebay Ln Unit LOT 42