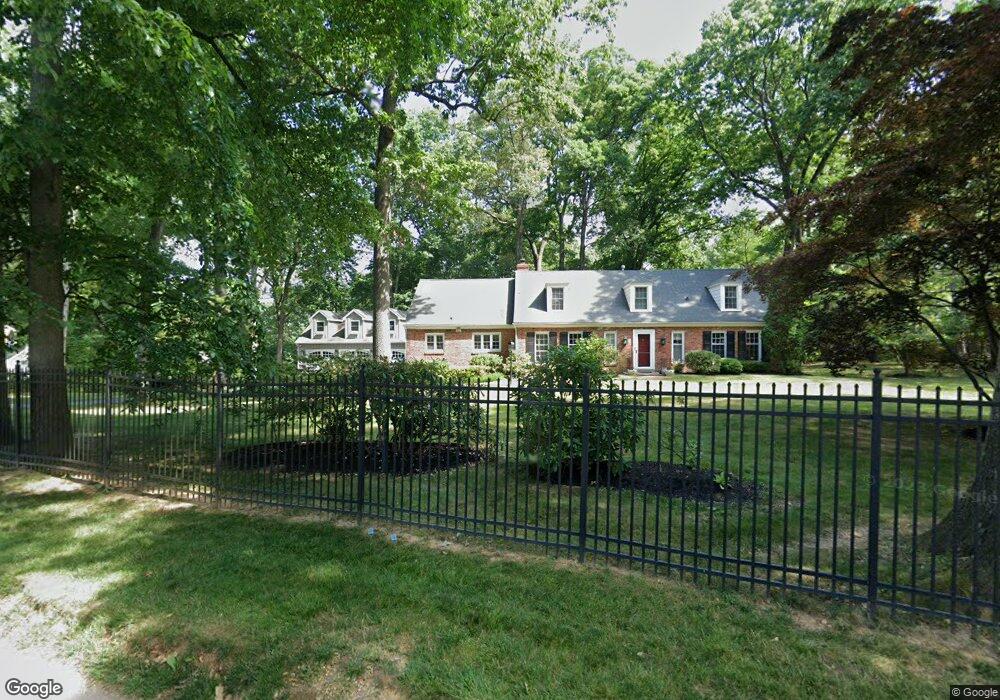
298 Upper Gulph Rd Radnor, PA 19087
Estimated Value: $1,027,000 - $1,388,000
4
Beds
3
Baths
3,212
Sq Ft
$384/Sq Ft
Est. Value
About This Home
This home is located at 298 Upper Gulph Rd, Radnor, PA 19087 and is currently estimated at $1,232,145, approximately $383 per square foot. 298 Upper Gulph Rd is a home located in Delaware County with nearby schools including Radnor El School, Radnor Middle School, and Radnor Senior High School.
Ownership History
Date
Name
Owned For
Owner Type
Purchase Details
Closed on
Apr 8, 2005
Sold by
Crispell Daniel and Crispell Susan Roma
Bought by
Glaser Barbara
Current Estimated Value
Purchase Details
Closed on
Aug 24, 1999
Sold by
Roe Barbara
Bought by
Gordon Edward J and Gordon Sarah D
Home Financials for this Owner
Home Financials are based on the most recent Mortgage that was taken out on this home.
Original Mortgage
$300,000
Interest Rate
5.75%
Purchase Details
Closed on
Sep 16, 1996
Sold by
Moult Constance
Bought by
Roe Barbara
Create a Home Valuation Report for This Property
The Home Valuation Report is an in-depth analysis detailing your home's value as well as a comparison with similar homes in the area
Home Values in the Area
Average Home Value in this Area
Purchase History
| Date | Buyer | Sale Price | Title Company |
|---|---|---|---|
| Glaser Barbara | $564,200 | -- | |
| Gordon Edward J | $400,000 | Fidelity National Title Ins | |
| Roe Barbara | $298,000 | -- |
Source: Public Records
Mortgage History
| Date | Status | Borrower | Loan Amount |
|---|---|---|---|
| Previous Owner | Gordon Edward J | $300,000 |
Source: Public Records
Tax History Compared to Growth
Tax History
| Year | Tax Paid | Tax Assessment Tax Assessment Total Assessment is a certain percentage of the fair market value that is determined by local assessors to be the total taxable value of land and additions on the property. | Land | Improvement |
|---|---|---|---|---|
| 2025 | $14,239 | $704,280 | $287,100 | $417,180 |
| 2024 | $14,239 | $704,280 | $287,100 | $417,180 |
| 2023 | $10,027 | $704,280 | $287,100 | $417,180 |
| 2022 | $10,027 | $704,280 | $287,100 | $417,180 |
| 2021 | $21,726 | $704,280 | $287,100 | $417,180 |
| 2020 | $12,213 | $351,080 | $148,650 | $202,430 |
| 2019 | $11,869 | $351,080 | $148,650 | $202,430 |
| 2018 | $11,636 | $351,080 | $0 | $0 |
| 2017 | $11,392 | $351,080 | $0 | $0 |
| 2016 | $1,966 | $351,080 | $0 | $0 |
| 2015 | $1,966 | $351,080 | $0 | $0 |
| 2014 | $1,966 | $351,080 | $0 | $0 |
Source: Public Records
Map
Nearby Homes
- 691 Twin Bridge Dr
- 400 Highview Dr
- 679 Crestwood Rd
- 484 King of Prussia Rd
- 301 Hughes Rd
- 1266 Gulph Creek Dr
- 105 Privet Ln
- 424 Weadley Rd
- 188 Arden Rd
- 458 Huston Rd
- 161 Lantern Ln
- 317 E Beechtree Ln
- 1052 Eagle Rd
- 156 Gypsy Ln
- 313 E Beechtree Ln
- Lot 1 Arden Rd
- Lot 3 Arden Rd
- 305 E Beechtree Ln
- 117 Arden Rd
- 2 Arden Rd
- 307 Pine Tree Rd
- 297 Upper Gulph Rd
- 293 Upper Gulph Rd
- 292 Upper Gulph Rd
- 300 Upper Gulph Rd
- 300 Pine Tree Rd
- 306 Pine Tree Rd
- 14 Northwoods Rd
- 8 Northwoods Rd
- 221 Pine Tree Rd
- 311 Pine Tree Rd
- 99 Woods Ln
- 4 Northwoods Rd
- 310 Pine Tree Rd
- 289 Upper Gulph Rd
- 101 Woods Ln
- 38 Northwoods Rd
- 217 Pine Tree Rd
- 15 Northwoods Rd
- 9 Northwoods Rd