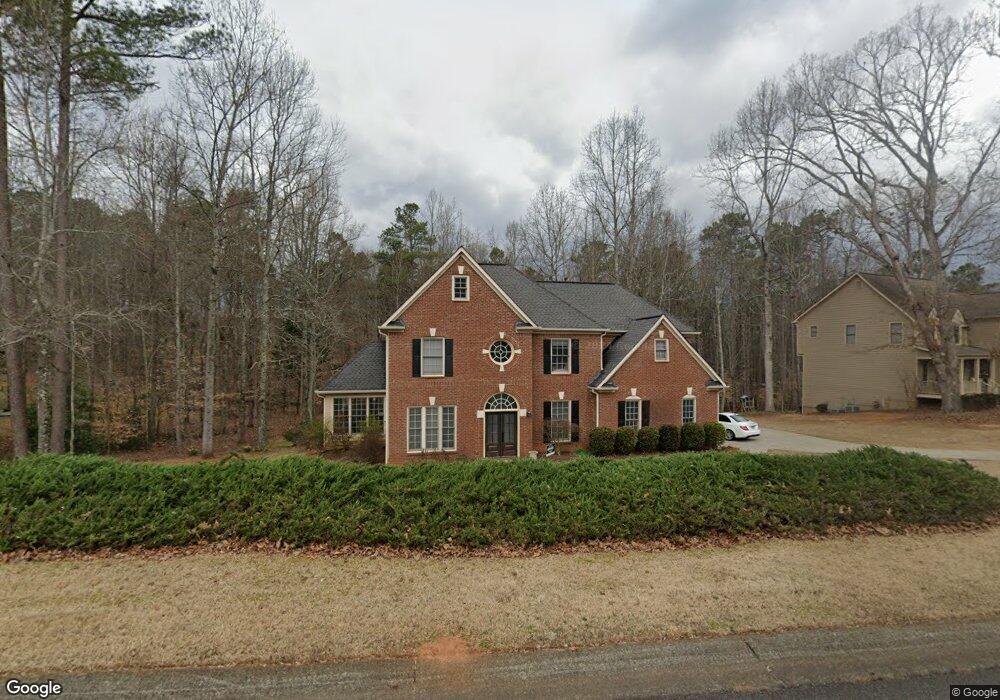
2980 Heatherwyn Way Cumming, GA 30040
Estimated Value: $547,960 - $619,000
4
Beds
3
Baths
2,562
Sq Ft
$230/Sq Ft
Est. Value
About This Home
This home is located at 2980 Heatherwyn Way, Cumming, GA 30040 and is currently estimated at $588,490, approximately $229 per square foot. 2980 Heatherwyn Way is a home located in Forsyth County with nearby schools including Cumming Elementary School, Otwell Middle School, and Forsyth Central High School.
Ownership History
Date
Name
Owned For
Owner Type
Purchase Details
Closed on
Jan 2, 2003
Sold by
Mtg Guaranty Insurance Corp
Bought by
Gilmer Toni A
Current Estimated Value
Home Financials for this Owner
Home Financials are based on the most recent Mortgage that was taken out on this home.
Original Mortgage
$152,250
Outstanding Balance
$65,614
Interest Rate
6.16%
Mortgage Type
New Conventional
Estimated Equity
$522,876
Purchase Details
Closed on
Feb 19, 2002
Sold by
Federal Home Loan Mortgage Corporation
Bought by
Mtg Guaranty Insurance Corp
Purchase Details
Closed on
Dec 4, 2001
Sold by
Chase Manhattan Mtg Corp
Bought by
Federal Home Mtg Corp
Purchase Details
Closed on
Oct 30, 1998
Bought by
Blackwell Robert J and Blackwell Brande
Home Financials for this Owner
Home Financials are based on the most recent Mortgage that was taken out on this home.
Original Mortgage
$184,800
Interest Rate
6.58%
Mortgage Type
New Conventional
Create a Home Valuation Report for This Property
The Home Valuation Report is an in-depth analysis detailing your home's value as well as a comparison with similar homes in the area
Home Values in the Area
Average Home Value in this Area
Purchase History
| Date | Buyer | Sale Price | Title Company |
|---|---|---|---|
| Gilmer Toni A | $203,000 | -- | |
| Mtg Guaranty Insurance Corp | -- | -- | |
| Federal Home Mtg Corp | -- | -- | |
| Chase Manhattan Mtg Corp | $213,870 | -- | |
| Blackwell Robert J | $194,600 | -- |
Source: Public Records
Mortgage History
| Date | Status | Borrower | Loan Amount |
|---|---|---|---|
| Open | Gilmer Toni A | $152,250 | |
| Previous Owner | Blackwell Robert J | $184,800 |
Source: Public Records
Tax History Compared to Growth
Tax History
| Year | Tax Paid | Tax Assessment Tax Assessment Total Assessment is a certain percentage of the fair market value that is determined by local assessors to be the total taxable value of land and additions on the property. | Land | Improvement |
|---|---|---|---|---|
| 2025 | $3,989 | $203,228 | $48,000 | $155,228 |
| 2024 | $3,989 | $199,064 | $48,000 | $151,064 |
| 2023 | $3,342 | $181,852 | $36,000 | $145,852 |
| 2022 | $3,520 | $124,036 | $26,000 | $98,036 |
| 2021 | $3,090 | $124,036 | $26,000 | $98,036 |
| 2020 | $3,097 | $124,376 | $26,000 | $98,376 |
| 2019 | $2,825 | $111,000 | $18,000 | $93,000 |
| 2018 | $2,806 | $109,580 | $18,000 | $91,580 |
| 2017 | $2,632 | $100,828 | $18,000 | $82,828 |
| 2016 | $2,632 | $100,828 | $18,000 | $82,828 |
| 2015 | $2,439 | $91,468 | $14,000 | $77,468 |
| 2014 | $2,159 | $84,852 | $14,000 | $70,852 |
Source: Public Records
Map
Nearby Homes
- 4985 Mccoy Cir
- 5340 Memento Trace
- 4900 Spot Rd
- 1735 Gordon Rd
- 2055 Cactus Ln
- 2165 Robin Hood Trail
- 4830 John Burruss Rd
- 1895 Nestledown Dr
- 3085 Aldrich Dr
- 1725 Mountainside Dr
- 1565 Dr Bramblett Rd
- 1630 Bettis Tribble Gap Rd
- 1525 Camden Cove Dr
- 2275 Doctor Bramblett Rd
- 1009 Canton Hwy
- 2545 Little John Ln
- 1835 Goldmine Dr
- 804 Canton Hwy
- 3365 Aldrich Dr
- 2990 Heatherwyn Way
- 2960 Heatherwyn Way
- 3010 Heatherwyn Way
- 2950 Heatherwyn Way
- 2915 Southfield Trail
- 2975 Heatherwyn Way
- 2985 Heatherwyn Way
- 2965 Heatherwyn Way
- 2905 Southfield Trail
- 3020 Heatherwyn Way
- 2955 Heatherwyn Way
- 2995 Heatherwyn Way
- 2925 Southfield Trail
- 2830 Heatherwyn Way
- 3005 Heatherwyn Way
- 2835 Southfield Trail
- 2945 Heatherwyn Way
- 3015 Heatherwyn Way
- 0 Southfield Trail Unit 7299693
- 0 Southfield Trail Unit 7061326