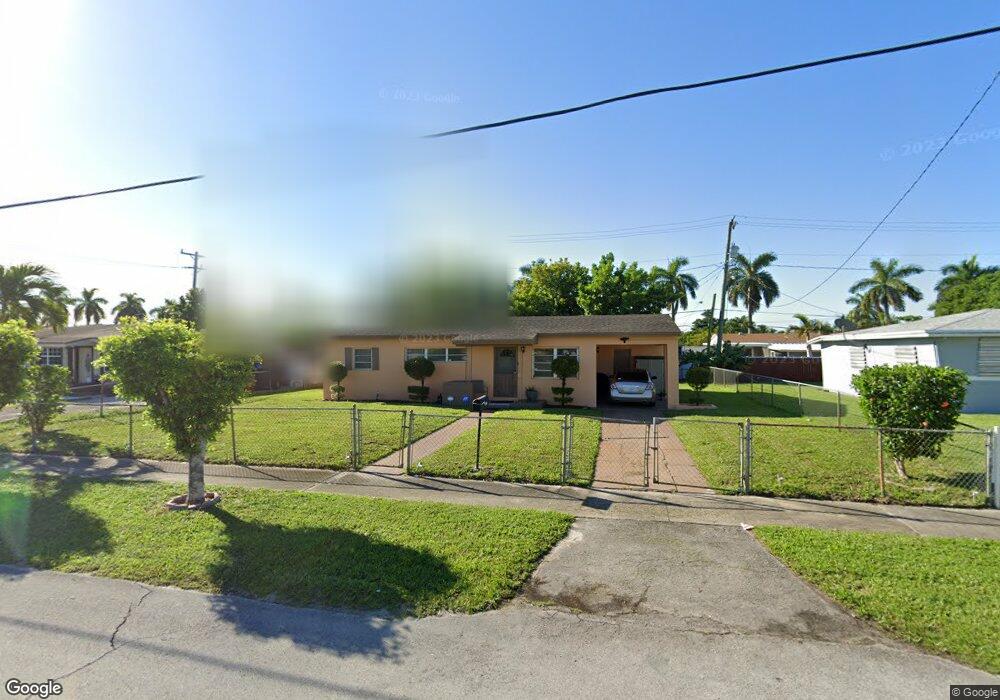
2980 NW 176th St Miami Gardens, FL 33056
Myrtle Grove NeighborhoodEstimated Value: $394,884 - $471,000
3
Beds
1
Bath
988
Sq Ft
$438/Sq Ft
Est. Value
About This Home
This home is located at 2980 NW 176th St, Miami Gardens, FL 33056 and is currently estimated at $432,971, approximately $438 per square foot. 2980 NW 176th St is a home located in Miami-Dade County with nearby schools including Carol City Middle School, Miami Carol City Senior High School, and Robert Morgan Educational Center.
Ownership History
Date
Name
Owned For
Owner Type
Purchase Details
Closed on
Oct 5, 2007
Sold by
Clayton Patricia and Clayton Stephanie
Bought by
Clayton Patricia
Current Estimated Value
Home Financials for this Owner
Home Financials are based on the most recent Mortgage that was taken out on this home.
Original Mortgage
$153,000
Outstanding Balance
$95,762
Interest Rate
6.26%
Mortgage Type
New Conventional
Estimated Equity
$337,209
Purchase Details
Closed on
Mar 23, 2006
Sold by
Clayton Patricia
Bought by
Clayton Patricia and Clayton Stephanie
Home Financials for this Owner
Home Financials are based on the most recent Mortgage that was taken out on this home.
Original Mortgage
$143,000
Interest Rate
6.85%
Mortgage Type
Unknown
Purchase Details
Closed on
Apr 23, 1996
Sold by
Goudiss Morton R
Bought by
Clayton Patricia
Home Financials for this Owner
Home Financials are based on the most recent Mortgage that was taken out on this home.
Original Mortgage
$63,967
Interest Rate
7.36%
Mortgage Type
FHA
Create a Home Valuation Report for This Property
The Home Valuation Report is an in-depth analysis detailing your home's value as well as a comparison with similar homes in the area
Home Values in the Area
Average Home Value in this Area
Purchase History
| Date | Buyer | Sale Price | Title Company |
|---|---|---|---|
| Clayton Patricia | -- | Exclusively Title Inc | |
| Clayton Patricia | -- | Exclusively Title Inc | |
| Clayton Patricia | $64,000 | -- |
Source: Public Records
Mortgage History
| Date | Status | Borrower | Loan Amount |
|---|---|---|---|
| Open | Clayton Patricia | $153,000 | |
| Closed | Clayton Patricia | $143,000 | |
| Closed | Clayton Patricia | $63,967 |
Source: Public Records
Tax History Compared to Growth
Tax History
| Year | Tax Paid | Tax Assessment Tax Assessment Total Assessment is a certain percentage of the fair market value that is determined by local assessors to be the total taxable value of land and additions on the property. | Land | Improvement |
|---|---|---|---|---|
| 2025 | $1,149 | $77,603 | -- | -- |
| 2024 | $1,008 | $75,416 | -- | -- |
| 2023 | $1,008 | $73,220 | $0 | $0 |
| 2022 | $951 | $71,088 | $0 | $0 |
| 2021 | $916 | $69,018 | $0 | $0 |
| 2020 | $913 | $68,066 | $0 | $0 |
| 2019 | $904 | $66,536 | $0 | $0 |
| 2018 | $1,252 | $65,296 | $0 | $0 |
| 2017 | $1,251 | $63,953 | $0 | $0 |
| 2016 | $1,211 | $62,638 | $0 | $0 |
| 2015 | $1,217 | $62,203 | $0 | $0 |
| 2014 | -- | $61,710 | $0 | $0 |
Source: Public Records
Map
Nearby Homes
- 2981 NW 174th St
- 17130 NW 29th Place
- 17140 NW 31st Ave
- 2920 NW 179th St
- 3010 NW 171st Terrace
- 2900 NW 179th St
- 2830 NW 172nd Terrace
- 3260 NW 174th St
- 2944 NW 180th St
- 2820 NW 180th St
- 2800 NW 180th St
- 3301 NW 174th St
- 2840 NW 171st St
- 2819 NW 181st St
- 3277 NW 179th St
- 2850 NW 170th St
- 18221 NW 29th Ct
- 17001 NW 28th Ave
- 3160 NW 169th Terrace
- 2940 NW 169th Terrace
- 2970 NW 176th St
- 3000 NW 176th St
- 2981 NW 175th St
- 2971 NW 175th St
- 3001 NW 175th St
- 3010 NW 176th St
- 3011 NW 175th St
- 3020 NW 176th St
- 3021 NW 175th St
- 2980 NW 175th St
- 3000 NW 175th St
- 3010 NW 175th St
- 3030 NW 176th St
- 3031 NW 175th St
- 2960 NW 175th St
- 3020 NW 175th St
- 2950 NW 175th St
- 3001 NW 174th St
- 17555 NW 29th Place