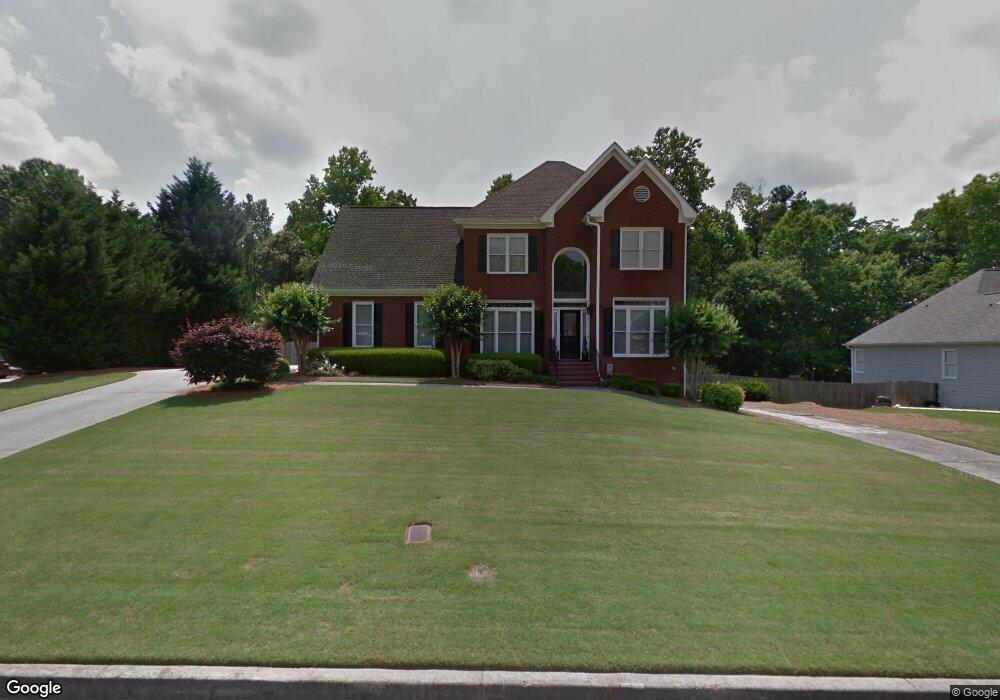
2982 Parks Run Unit 1 Loganville, GA 30052
Estimated Value: $456,470 - $616,000
4
Beds
4
Baths
3,528
Sq Ft
$144/Sq Ft
Est. Value
About This Home
This home is located at 2982 Parks Run Unit 1, Loganville, GA 30052 and is currently estimated at $508,118, approximately $144 per square foot. 2982 Parks Run Unit 1 is a home located in Gwinnett County with nearby schools including W.J. Cooper Elementary School, McConnell Middle School, and Archer High School.
Ownership History
Date
Name
Owned For
Owner Type
Purchase Details
Closed on
May 12, 2011
Sold by
Ewing Irrigation Products Inc
Bought by
Steverson Felicia and Steverson Derek
Current Estimated Value
Home Financials for this Owner
Home Financials are based on the most recent Mortgage that was taken out on this home.
Original Mortgage
$185,183
Outstanding Balance
$126,417
Interest Rate
4.5%
Mortgage Type
FHA
Estimated Equity
$381,701
Purchase Details
Closed on
Aug 17, 2010
Sold by
Johnston Steven and Johnston Michelle
Bought by
Ewing Irrigation Products Inc
Purchase Details
Closed on
May 9, 2003
Sold by
Lynch Gordon and Lynch Janet
Bought by
Lynch Steven
Home Financials for this Owner
Home Financials are based on the most recent Mortgage that was taken out on this home.
Original Mortgage
$205,200
Interest Rate
5.81%
Mortgage Type
New Conventional
Purchase Details
Closed on
Apr 15, 1996
Sold by
Encore Homes Inc
Bought by
Lynch Gordon Jane
Create a Home Valuation Report for This Property
The Home Valuation Report is an in-depth analysis detailing your home's value as well as a comparison with similar homes in the area
Home Values in the Area
Average Home Value in this Area
Purchase History
| Date | Buyer | Sale Price | Title Company |
|---|---|---|---|
| Steverson Felicia | $190,000 | -- | |
| Ewing Irrigation Products Inc | $225,000 | -- | |
| Lynch Steven | $216,000 | -- | |
| Lynch Gordon Jane | $151,500 | -- |
Source: Public Records
Mortgage History
| Date | Status | Borrower | Loan Amount |
|---|---|---|---|
| Open | Steverson Felicia | $185,183 | |
| Previous Owner | Lynch Steven | $205,200 | |
| Closed | Lynch Gordon Jane | $0 |
Source: Public Records
Tax History Compared to Growth
Tax History
| Year | Tax Paid | Tax Assessment Tax Assessment Total Assessment is a certain percentage of the fair market value that is determined by local assessors to be the total taxable value of land and additions on the property. | Land | Improvement |
|---|---|---|---|---|
| 2024 | $4,874 | $173,720 | $24,000 | $149,720 |
| 2023 | $4,874 | $171,600 | $28,000 | $143,600 |
| 2022 | $4,564 | $160,680 | $24,000 | $136,680 |
| 2021 | $3,660 | $114,320 | $20,400 | $93,920 |
| 2020 | $3,686 | $114,320 | $20,400 | $93,920 |
| 2019 | $3,421 | $106,400 | $18,800 | $87,600 |
| 2018 | $3,134 | $93,680 | $12,800 | $80,880 |
| 2016 | $2,958 | $84,560 | $12,800 | $71,760 |
| 2015 | $2,983 | $84,560 | $12,800 | $71,760 |
| 2014 | $2,745 | $73,080 | $10,800 | $62,280 |
Source: Public Records
Map
Nearby Homes
- 2982 Parks Run
- 434 434 Sterling Creek Way
- 2992 Parks Run
- 2972 Parks Run Unit 1
- 3012 Parks Run
- 2995 Parks Run
- 2995 Parks Run
- 2962 Parks Run Unit 1
- 2985 Parks Run Unit 1
- 2975 Parks Run
- 3005 Parks Run
- 2952 Parks Run
- 2952 Parks Run Unit 1/50
- 3015 Parks Run
- 2965 Parks Run
- 3032 Parks Run
- 2968 Mary Alice Trail
- 2955 Parks Run Unit 1
- 3025 Parks Run Unit 1
- 2978 Mary Alice Trail