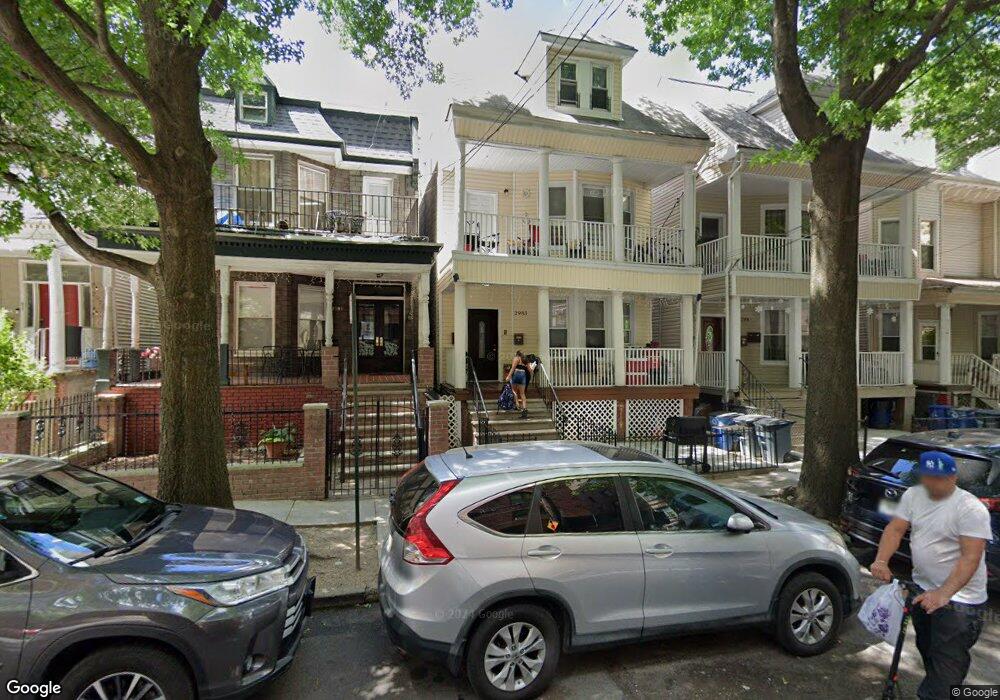
2983 Briggs Ave Bronx, NY 10458
Bedford Park NeighborhoodEstimated Value: $824,007 - $1,130,000
6
Beds
2
Baths
2,484
Sq Ft
$379/Sq Ft
Est. Value
About This Home
This home is located at 2983 Briggs Ave, Bronx, NY 10458 and is currently estimated at $942,502, approximately $379 per square foot. 2983 Briggs Ave is a home located in Bronx County with nearby schools including P.S. 008 Isaac Varian, J.H.S. 080 The Mosholu Parkway, and St Philip Neri School.
Ownership History
Date
Name
Owned For
Owner Type
Purchase Details
Closed on
May 4, 2021
Sold by
Master Development 26 Corp
Bought by
2983 Briggs Assets Llc
Current Estimated Value
Purchase Details
Closed on
Jun 5, 2019
Sold by
Randazzo Esq As Referee Joyce
Bought by
Master Development 26 Corp
Home Financials for this Owner
Home Financials are based on the most recent Mortgage that was taken out on this home.
Original Mortgage
$330,000
Interest Rate
4.1%
Mortgage Type
New Conventional
Purchase Details
Closed on
Jul 12, 1999
Sold by
Rivera Haydee and Rodriguez Laura
Bought by
Winstead Vera
Home Financials for this Owner
Home Financials are based on the most recent Mortgage that was taken out on this home.
Original Mortgage
$194,900
Interest Rate
7.85%
Mortgage Type
Credit Line Revolving
Create a Home Valuation Report for This Property
The Home Valuation Report is an in-depth analysis detailing your home's value as well as a comparison with similar homes in the area
Home Values in the Area
Average Home Value in this Area
Purchase History
| Date | Buyer | Sale Price | Title Company |
|---|---|---|---|
| 2983 Briggs Assets Llc | -- | -- | |
| Master Development 26 Corp | $375,180 | -- | |
| Winstead Vera | $195,000 | The Judicial Title Ins Agenc |
Source: Public Records
Mortgage History
| Date | Status | Borrower | Loan Amount |
|---|---|---|---|
| Previous Owner | Master Development 26 Corp | $330,000 | |
| Previous Owner | Winstead Vera | $194,900 |
Source: Public Records
Tax History
| Year | Tax Paid | Tax Assessment Tax Assessment Total Assessment is a certain percentage of the fair market value that is determined by local assessors to be the total taxable value of land and additions on the property. | Land | Improvement |
|---|---|---|---|---|
| 2025 | $5,893 | $29,593 | $6,032 | $23,561 |
| 2024 | $5,893 | $29,342 | $5,421 | $23,921 |
| 2023 | $5,625 | $27,695 | $5,831 | $21,864 |
| 2022 | $5,221 | $46,320 | $9,600 | $36,720 |
| 2021 | $5,195 | $44,760 | $9,600 | $35,160 |
| 2020 | $5,220 | $39,900 | $9,600 | $30,300 |
| 2019 | $5,115 | $32,160 | $9,600 | $22,560 |
| 2018 | $4,705 | $23,079 | $7,758 | $15,321 |
| 2017 | $4,443 | $21,795 | $7,311 | $14,484 |
| 2016 | $4,112 | $20,571 | $7,480 | $13,091 |
| 2015 | $1,502 | $20,551 | $6,634 | $13,917 |
| 2014 | $1,502 | $20,377 | $7,721 | $12,656 |
Source: Public Records
Map
Nearby Homes
- 3000 Valentine Ave Unit 5G
- 3000 Valentine Ave Unit 2E
- 3000 Valentine Ave Unit 1D
- 285 E 203rd St
- 306 E Mosholu Pkwy S Unit 1D
- 306 E Mosholu Pkwy S Unit 3K
- 306 E Mosholu Pkwy S Unit 3D
- 190 E Mosholu Pkwy S Unit 6H
- 190 E Mosholu Pkwy S Unit 4C
- 190 E Mosholu Pkwy S Unit 3C
- 2969 Perry Ave
- 3130 Grand Concourse Unit 2J
- 325 E 201st St Unit 5F
- 325 E 201st St Unit 4D
- 325 E 201st St Unit 3J
- 203 E 205th St
- 340 E Mosholu Pkwy S Unit 2C
- 340 E Mosholu Pkwy S Unit 1-A
- 340 E Mosholu Pkwy S Unit 4E
- 3131 Grand Concourse Unit 5D
- 2981 Briggs Ave
- 2985 Briggs Ave
- 2979 Briggs Ave
- 260 E 201st St
- 2977 Briggs Ave
- 2975 Briggs Ave
- 2980 Valentine Ave
- 2973 Briggs Ave
- 2980 Briggs Ave Unit 3 E
- 2980 Briggs Ave Unit 2 A
- 2980 Briggs Ave Unit 2 J
- 2980 Briggs Ave Unit 6E
- 2980 Briggs Ave Unit 6J
- 2980 Briggs Ave Unit 6C
- 2980 Briggs Ave Unit 3F
- 2980 Briggs Ave
- 2980 Briggs Ave Unit 6D
- 2980 Briggs Ave Unit 4E
- 2980 Briggs Ave Unit 2F
- 2980 Briggs Ave Unit 3G
Your Personal Tour Guide
Ask me questions while you tour the home.