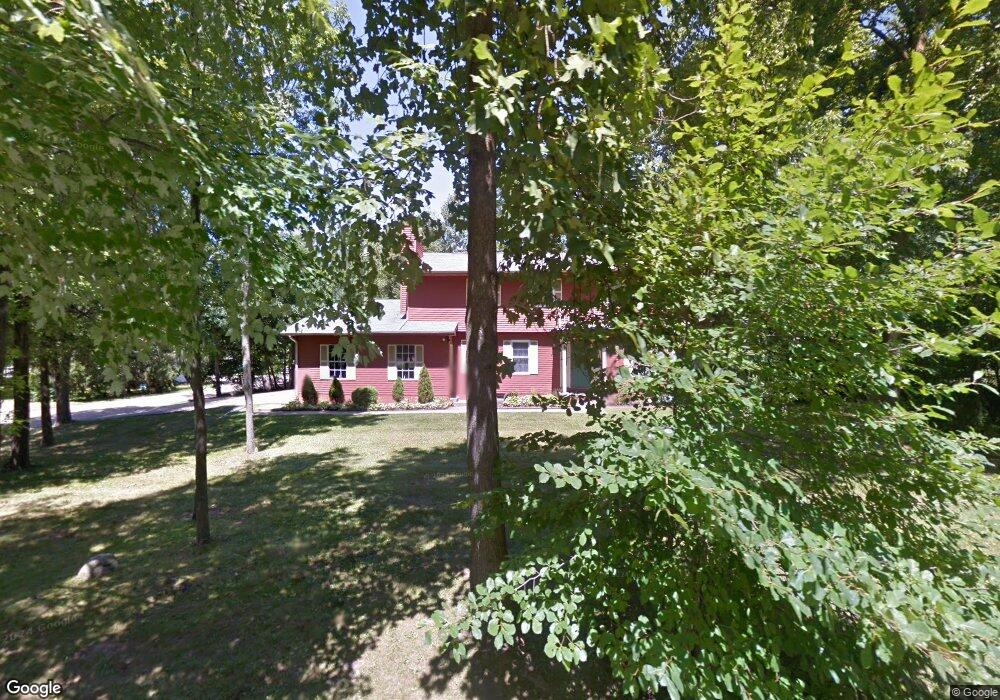
2983 Lee St NW Unit 2983 North Canton, OH 44720
Estimated Value: $178,000 - $219,442
3
Beds
2
Baths
1,522
Sq Ft
$130/Sq Ft
Est. Value
About This Home
This home is located at 2983 Lee St NW Unit 2983, North Canton, OH 44720 and is currently estimated at $198,361, approximately $130 per square foot. 2983 Lee St NW Unit 2983 is a home located in Stark County with nearby schools including Northwood Elementary School, North Canton Middle School, and Hoover High School.
Ownership History
Date
Name
Owned For
Owner Type
Purchase Details
Closed on
Sep 30, 2009
Sold by
Ott Amanda E and Ott Michael R
Bought by
Wheeler Neal E
Current Estimated Value
Home Financials for this Owner
Home Financials are based on the most recent Mortgage that was taken out on this home.
Original Mortgage
$108,007
Outstanding Balance
$70,922
Interest Rate
5.19%
Mortgage Type
FHA
Estimated Equity
$127,439
Purchase Details
Closed on
Mar 30, 2006
Sold by
Bailey Darren L
Bought by
Bailey Amanda E
Purchase Details
Closed on
Jun 22, 2001
Sold by
Rush James L
Bought by
Bailey Darren L and Bailey Amanda E
Home Financials for this Owner
Home Financials are based on the most recent Mortgage that was taken out on this home.
Original Mortgage
$68,800
Interest Rate
7.18%
Purchase Details
Closed on
Sep 11, 1989
Create a Home Valuation Report for This Property
The Home Valuation Report is an in-depth analysis detailing your home's value as well as a comparison with similar homes in the area
Home Values in the Area
Average Home Value in this Area
Purchase History
| Date | Buyer | Sale Price | Title Company |
|---|---|---|---|
| Wheeler Neal E | $110,000 | Attorney | |
| Bailey Amanda E | -- | None Available | |
| Bailey Darren L | $86,000 | Mk Title Agency Of Stark Cou | |
| -- | $68,500 | -- |
Source: Public Records
Mortgage History
| Date | Status | Borrower | Loan Amount |
|---|---|---|---|
| Open | Wheeler Neal E | $108,007 | |
| Previous Owner | Bailey Darren L | $68,800 |
Source: Public Records
Tax History Compared to Growth
Tax History
| Year | Tax Paid | Tax Assessment Tax Assessment Total Assessment is a certain percentage of the fair market value that is determined by local assessors to be the total taxable value of land and additions on the property. | Land | Improvement |
|---|---|---|---|---|
| 2025 | -- | $55,900 | $8,720 | $47,180 |
| 2024 | -- | $55,900 | $8,720 | $47,180 |
| 2023 | $2,542 | $48,060 | $6,790 | $41,270 |
| 2022 | $2,437 | $48,060 | $6,790 | $41,270 |
| 2021 | $2,508 | $48,060 | $6,790 | $41,270 |
| 2020 | $2,425 | $42,460 | $6,270 | $36,190 |
| 2019 | $2,270 | $42,460 | $6,270 | $36,190 |
| 2018 | $2,352 | $42,460 | $6,270 | $36,190 |
| 2017 | $1,952 | $37,140 | $6,270 | $30,870 |
| 2016 | $1,960 | $37,140 | $6,270 | $30,870 |
| 2015 | $1,966 | $37,140 | $6,270 | $30,870 |
| 2014 | $72 | $37,040 | $7,180 | $29,860 |
| 2013 | $1,019 | $36,410 | $7,180 | $29,230 |
Source: Public Records
Map
Nearby Homes
- 2884 Sutherland Cir NW
- 2840 Barclay Cir NW
- 3278 Sumser St NW Unit 2
- 9120 Bletchley Ave NW
- 3077 Whitewood St NW
- 9276 Shipton Cir NW
- 9364 Pheasant Valley Ave NW
- 8037 Norriton Cir NW
- 7995 Woodrush Dr NW
- 8173 Spencer Ave NW
- 8510 Deacon Ave NW
- 9520-9570 Cleveland Ave NW
- 7890 Killington Ave NW
- 7907 Amberly Cir NW Unit 7
- 8817 Pleasantwood Ave NW
- 2626 Northam Cir NW
- 7840 Newgate Ave NW
- 7831 Windbur Cir NW
- 2315 Rutgers St NW
- 3047 Chalford Cir NW Unit 46B
- 2981 Lee St NW Unit 2981
- 8722 Wedgewood Ave NW Unit 1
- 8722 Wedgewood Ave NW Unit 1
- 8722 Wedgewood Ave NW
- 8724 Wedgewood Ave NW Unit 2
- 2963 Lee St NW
- 3001 Lee St NW Unit 3001
- 3047 Thornton St NW
- 3028 Thornton St NW
- 3006 Thornton St NW
- 3054 Thornton St NW
- 3004 Thornton St NW
- 3003 Lee St NW Unit 3003
- 2986 Lee St NW
- 2984 Lee St NW Unit 2984
- 3027 Lee St NW
- 3027 Lee St NW Unit 3027 Lee st. NW
- 2993 Thornton St NW
- 2960 Lee St NW
- 3026 Thornton St NW