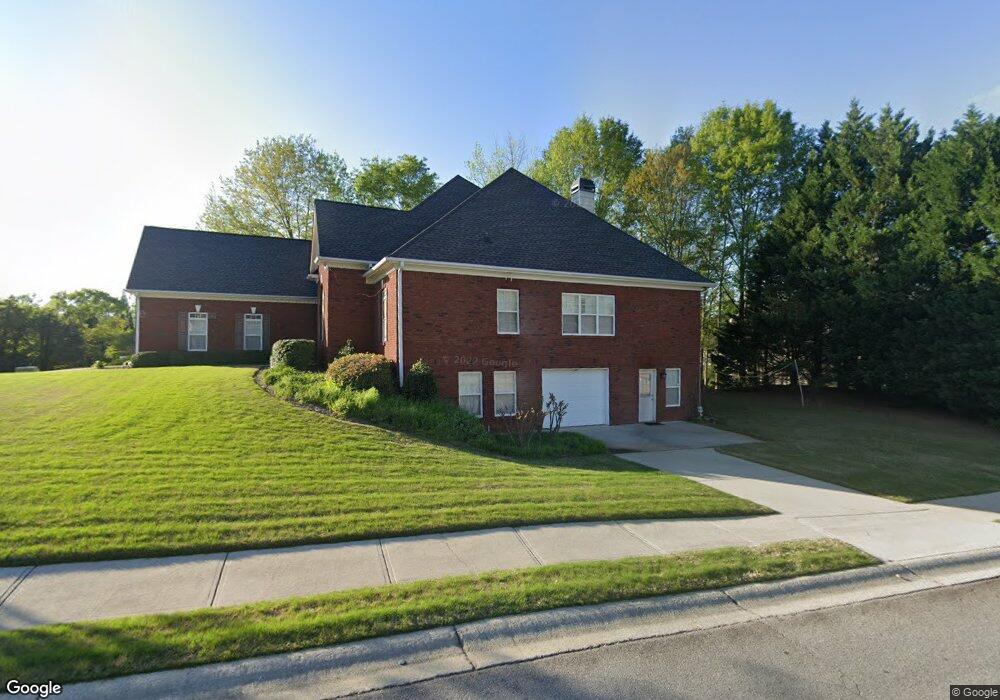
2983 Legislative Ln Unit 1 Buford, GA 30519
Estimated Value: $540,000 - $612,000
4
Beds
3
Baths
2,693
Sq Ft
$213/Sq Ft
Est. Value
About This Home
This home is located at 2983 Legislative Ln Unit 1, Buford, GA 30519 and is currently estimated at $573,975, approximately $213 per square foot. 2983 Legislative Ln Unit 1 is a home located in Hall County with nearby schools including Friendship Elementary School, Cherokee Bluff Middle School, and Cherokee Bluff High School.
Ownership History
Date
Name
Owned For
Owner Type
Purchase Details
Closed on
Mar 24, 2006
Sold by
Bagwell Brian
Bought by
Pennington Thomas Earl and Pennington Eva P
Current Estimated Value
Home Financials for this Owner
Home Financials are based on the most recent Mortgage that was taken out on this home.
Original Mortgage
$57,420
Outstanding Balance
$32,673
Interest Rate
6.19%
Mortgage Type
Unknown
Estimated Equity
$541,302
Purchase Details
Closed on
Sep 25, 2002
Sold by
Telluride Properties Inc
Bought by
Bagwell Brian
Home Financials for this Owner
Home Financials are based on the most recent Mortgage that was taken out on this home.
Original Mortgage
$217,600
Interest Rate
5.98%
Mortgage Type
New Conventional
Purchase Details
Closed on
Apr 18, 2002
Sold by
Chateau Corners Development Corp
Bought by
Telluride Properties Inc
Create a Home Valuation Report for This Property
The Home Valuation Report is an in-depth analysis detailing your home's value as well as a comparison with similar homes in the area
Home Values in the Area
Average Home Value in this Area
Purchase History
| Date | Buyer | Sale Price | Title Company |
|---|---|---|---|
| Pennington Thomas Earl | $287,100 | -- | |
| Bagwell Brian | $272,000 | -- | |
| Telluride Properties Inc | $96,000 | -- |
Source: Public Records
Mortgage History
| Date | Status | Borrower | Loan Amount |
|---|---|---|---|
| Open | Pennington Thomas Earl | $57,420 | |
| Open | Pennington Thomas Earl | $229,680 | |
| Previous Owner | Bagwell Brian | $217,600 |
Source: Public Records
Tax History Compared to Growth
Tax History
| Year | Tax Paid | Tax Assessment Tax Assessment Total Assessment is a certain percentage of the fair market value that is determined by local assessors to be the total taxable value of land and additions on the property. | Land | Improvement |
|---|---|---|---|---|
| 2024 | $5,635 | $226,480 | $38,800 | $187,680 |
| 2023 | $4,510 | $198,240 | $28,920 | $169,320 |
| 2022 | $4,683 | $181,040 | $27,360 | $153,680 |
| 2021 | $4,167 | $158,400 | $17,000 | $141,400 |
| 2020 | $4,141 | $153,040 | $17,000 | $136,040 |
| 2019 | $3,988 | $146,160 | $16,000 | $130,160 |
| 2018 | $4,029 | $143,000 | $16,000 | $127,000 |
| 2017 | $3,772 | $130,840 | $12,000 | $118,840 |
| 2016 | $3,206 | $114,120 | $12,000 | $102,120 |
| 2015 | $3,147 | $114,120 | $12,000 | $102,120 |
| 2014 | $3,147 | $111,206 | $12,000 | $99,206 |
Source: Public Records
Map
Nearby Homes
- 2638 Democracy Dr Unit 1
- 2228 Mayors Way
- 2342 Sparta Way
- Sierra Plan at Sherwood Square
- Sawnee Plan at Sherwood Square
- 3088 Lantana Way
- 3138 Lantana Way
- 7289 Mulberry Trace Ln Unit LOT 178
- 7296 Mulberry Trace Ln Unit LOT 180
- 7296 Mulberry Trace Ln
- 7300 Mulberry Trace Ln
- 7300 Mulberry Trace Ln Unit LOT 181
- 7304 Mulberry Trace Ln Unit LOT 182
- 7304 Mulberry Trace Ln
- 7308 Mulberry Trace Ln Unit LOT 183
- 7308 Mulberry Trace Ln
- 7312 Mulberry Trace Ln Unit LOT 184
- 7312 Mulberry Trace Ln
- 7316 Mulberry Trace Ln
- 7316 Mulberry Trace Ln Unit LOT 185
- 2979 Legislative Ln
- 2825 Legislative Ln
- 2820 Legislative Ln Unit 1
- 2816 Legislative Ln
- 2967 Legislative Ln Unit 1
- 2811 Legislative Ln
- 2824 Legislative Ln
- 2829 Legislative Ln
- 2955 Legislative Ln Unit 1
- 2978 Legislative Ln
- 2812 Legislative Ln
- 2812 Legislative Ln Unit 26
- 2828 Legislative Ln Unit 1
- 2927 Legislative Ln
- 2833 Legislative Ln
- 2974 Legislative Ln Unit 1
- 2808 Legislative Ln Unit 1
- 2805 Legislative Ln
- 2832 Legislative Ln
- 2923 Legislative Ln Unit 1