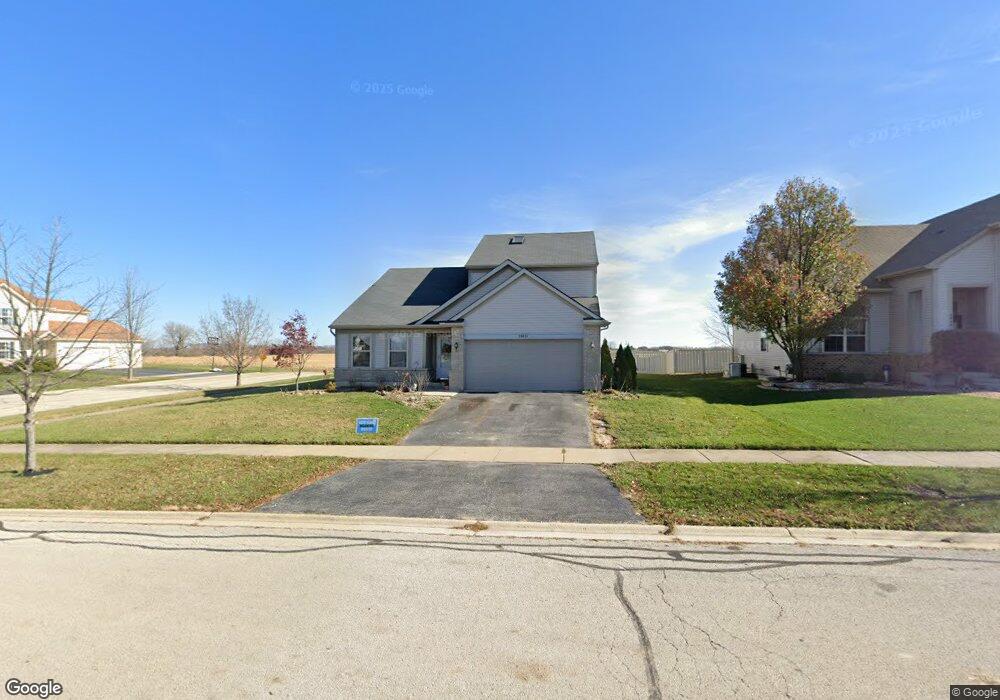
29831 Trim Creek Ln Beecher, IL 60401
Estimated Value: $268,000 - $341,000
3
Beds
3
Baths
1,654
Sq Ft
$188/Sq Ft
Est. Value
About This Home
This home is located at 29831 Trim Creek Ln, Beecher, IL 60401 and is currently estimated at $310,667, approximately $187 per square foot. 29831 Trim Creek Ln is a home located in Will County with nearby schools including Beecher Elementary School, Beecher Junior High School, and Beecher High School.
Ownership History
Date
Name
Owned For
Owner Type
Purchase Details
Closed on
Jul 14, 2017
Sold by
Hsbc Bank Usa National Association
Bought by
Cracco Jordan
Current Estimated Value
Home Financials for this Owner
Home Financials are based on the most recent Mortgage that was taken out on this home.
Original Mortgage
$145,500
Interest Rate
3.9%
Mortgage Type
New Conventional
Purchase Details
Closed on
Feb 10, 2017
Sold by
Robinson Naomi M
Bought by
Hsbc Bank Usa National Association
Purchase Details
Closed on
Dec 12, 2016
Sold by
Robinson Naomi M
Bought by
Hsbc Bank Usa National Association
Purchase Details
Closed on
Aug 29, 2005
Sold by
Mgm Construction Co Inc
Bought by
Robinson Naomi M
Home Financials for this Owner
Home Financials are based on the most recent Mortgage that was taken out on this home.
Original Mortgage
$43,000
Interest Rate
6.01%
Mortgage Type
Stand Alone Second
Create a Home Valuation Report for This Property
The Home Valuation Report is an in-depth analysis detailing your home's value as well as a comparison with similar homes in the area
Home Values in the Area
Average Home Value in this Area
Purchase History
| Date | Buyer | Sale Price | Title Company |
|---|---|---|---|
| Cracco Jordan | $150,000 | Reltco Inc | |
| Hsbc Bank Usa National Association | -- | Premier Title | |
| Hsbc Bank Usa National Association | -- | Premier Title | |
| Robinson Naomi M | $217,000 | Chicago Title Insurance Co |
Source: Public Records
Mortgage History
| Date | Status | Borrower | Loan Amount |
|---|---|---|---|
| Previous Owner | Cracco Jordan | $145,500 | |
| Previous Owner | Robinson Naomi M | $43,000 | |
| Previous Owner | Robinson Naomi M | $172,000 |
Source: Public Records
Tax History Compared to Growth
Tax History
| Year | Tax Paid | Tax Assessment Tax Assessment Total Assessment is a certain percentage of the fair market value that is determined by local assessors to be the total taxable value of land and additions on the property. | Land | Improvement |
|---|---|---|---|---|
| 2024 | $6,097 | $79,379 | $21,367 | $58,012 |
| 2023 | $6,097 | $71,946 | $19,366 | $52,580 |
| 2022 | $4,682 | $60,710 | $18,487 | $42,223 |
| 2021 | $4,876 | $56,265 | $17,133 | $39,132 |
| 2020 | $4,719 | $52,462 | $15,975 | $36,487 |
| 2019 | $4,506 | $49,316 | $15,017 | $34,299 |
| 2018 | $4,374 | $46,306 | $14,100 | $32,206 |
| 2017 | $4,268 | $44,706 | $13,613 | $31,093 |
| 2016 | $4,360 | $44,706 | $13,613 | $31,093 |
| 2015 | $4,163 | $44,220 | $13,465 | $30,755 |
| 2014 | $4,163 | $44,667 | $13,601 | $31,066 |
| 2013 | $4,163 | $46,654 | $14,206 | $32,448 |
Source: Public Records
Map
Nearby Homes
- 236 Poplar Ln
- 253 Aspen Dr
- 1053 Sycamore St
- 259 Fir St
- 270 Aspen Dr
- 1426 Rolling Pass
- 279 Aspen Dr
- 1401 Rolling Pass
- 1360 Pheasant Chase Cir
- 286 Sunset Blvd
- 318 Maple St
- 0000 Church Rd NE
- 30 Acres Church and Racine Ave
- 300 Dixie Hwy
- Vacant Hunters Dr
- 151 Sawgrass Ln
- 1545 Rolling Pass
- 1519 Sawgrass Ln
- 322 Orchard Ln
- 291 Fairway Dr
- 29841 Trim Creek Ln
- 341 Bald Eagle Ln
- 29851 Trim Creek Ln
- 260 Bald Eagle Ln
- 250 Bald Eagle Ln
- 29861 Trim Creek Ln
- 230 Pelicans Nest
- 230 Bald Eagle Ln
- 219 Bald Eagle Ln
- 220 Pelicans Nest
- 220 Bald Eagle Ln
- 210 Pelicans Nest
- 210 Bald Eagle Ln
- 29884 Trim Creek Ln
- 29891 Trim Creek Ln
- 200 Pelicans Nest
- 189 Bald Eagle Ln
- 189 Bald Eagle Lane (#275)
- 29901 Trim Creek Ln
- 29911 Trim Creek Ln