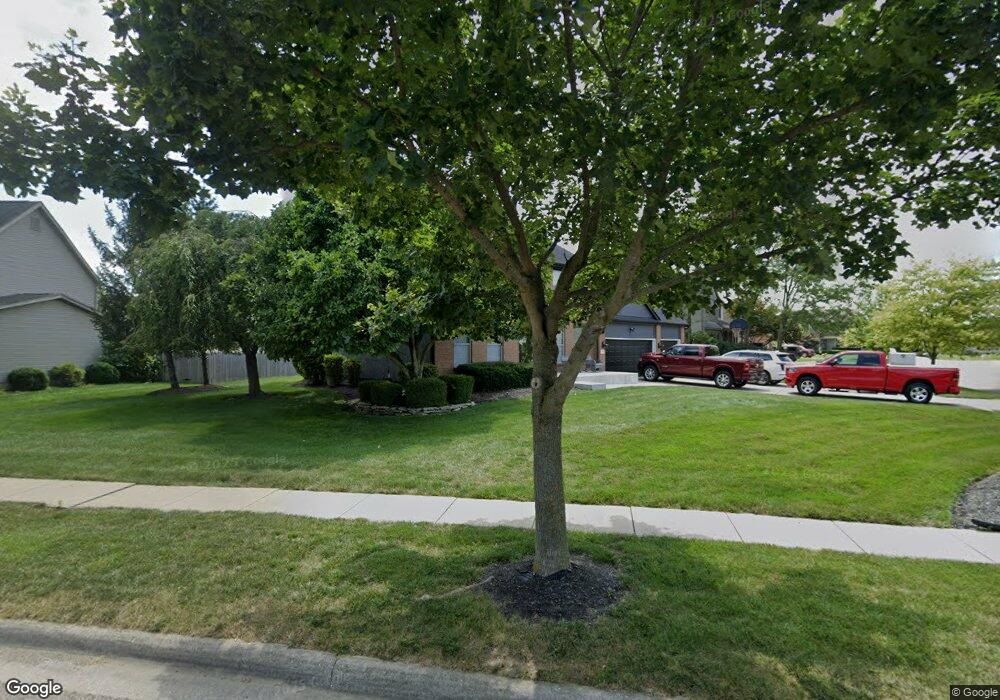
2985 Wynstone Ct Grove City, OH 43123
Estimated Value: $506,822 - $531,000
4
Beds
3
Baths
3,006
Sq Ft
$173/Sq Ft
Est. Value
About This Home
This home is located at 2985 Wynstone Ct, Grove City, OH 43123 and is currently estimated at $520,456, approximately $173 per square foot. 2985 Wynstone Ct is a home located in Franklin County with nearby schools including Hayes Intermediate School, Jc Sommer Elementary School, and Jackson Middle School.
Ownership History
Date
Name
Owned For
Owner Type
Purchase Details
Closed on
Jul 2, 2024
Sold by
Lincoln Brian E
Bought by
Lincoln Brian E and Lincoln Tiffany
Current Estimated Value
Purchase Details
Closed on
Nov 19, 2010
Sold by
Haas Arthur D and Haas Kathie L
Bought by
Lincoln Brian E
Home Financials for this Owner
Home Financials are based on the most recent Mortgage that was taken out on this home.
Original Mortgage
$204,676
Interest Rate
4.25%
Mortgage Type
FHA
Purchase Details
Closed on
Jan 10, 1997
Sold by
Mobley Homes Of Columbus
Bought by
Haas Arthur D and Haas Kathie L
Home Financials for this Owner
Home Financials are based on the most recent Mortgage that was taken out on this home.
Original Mortgage
$194,800
Interest Rate
7.58%
Mortgage Type
Balloon
Purchase Details
Closed on
Oct 4, 1995
Sold by
Haughn Road Assoc
Bought by
Mobley Homes Of Columbus Inc
Create a Home Valuation Report for This Property
The Home Valuation Report is an in-depth analysis detailing your home's value as well as a comparison with similar homes in the area
Home Values in the Area
Average Home Value in this Area
Purchase History
| Date | Buyer | Sale Price | Title Company |
|---|---|---|---|
| Lincoln Brian E | -- | Title Connect Agency | |
| Lincoln Brian E | $210,000 | Title First | |
| Haas Arthur D | $221,800 | -- | |
| Mobley Homes Of Columbus Inc | $122,000 | -- |
Source: Public Records
Mortgage History
| Date | Status | Borrower | Loan Amount |
|---|---|---|---|
| Previous Owner | Lincoln Brian E | $204,676 | |
| Previous Owner | Haas Arthur D | $194,800 |
Source: Public Records
Tax History Compared to Growth
Tax History
| Year | Tax Paid | Tax Assessment Tax Assessment Total Assessment is a certain percentage of the fair market value that is determined by local assessors to be the total taxable value of land and additions on the property. | Land | Improvement |
|---|---|---|---|---|
| 2024 | $7,604 | $167,200 | $35,700 | $131,500 |
| 2023 | $7,496 | $167,195 | $35,700 | $131,495 |
| 2022 | $7,227 | $118,510 | $18,900 | $99,610 |
| 2021 | $7,367 | $118,510 | $18,900 | $99,610 |
| 2020 | $7,343 | $118,510 | $18,900 | $99,610 |
| 2019 | $6,508 | $97,440 | $15,750 | $81,690 |
| 2018 | $5,907 | $97,440 | $15,750 | $81,690 |
| 2017 | $5,894 | $97,440 | $15,750 | $81,690 |
| 2016 | $5,328 | $73,510 | $19,010 | $54,500 |
| 2015 | $5,330 | $73,510 | $19,010 | $54,500 |
| 2014 | $5,334 | $73,510 | $19,010 | $54,500 |
| 2013 | $2,517 | $73,500 | $19,005 | $54,495 |
Source: Public Records
Map
Nearby Homes
- 3022 Crabapple Place Unit 4
- 4879 Blossom Way Unit 41
- 4838 Adwell Loop
- 4754 Glencross Ct
- 2750 Longridge Way
- 3195 Longridge Way
- 4521 Haughn Rd
- 3234 Callie Marie Dr
- 4208 Mayfair Ct N
- 3300 Belgreen Dr
- 2720 Loris Way
- 4598 Gillenbury Loop W
- 2651 Hoover Crossing Way
- 5148 Keefer Ln
- 5124 Keefer Ln
- 4881 Primrose Ct
- 2618 Vililly Cir W
- 2642 Gardenview Loop
- 2873 Woodgrove Dr
- 3171 Orders Rd
- 2965 Longridge Way
- 2995 Wynstone Ct
- 2955 Longridge Way
- 2992 Longridge Way
- 2960 Longridge Way
- 2992 Wynstone Ct
- 2964 Dunhurst Ct
- 3005 Wynstone Ct
- 2970 Longridge Way
- 3002 Wynstone Ct
- 4739 Longridge Ct
- 2945 Longridge Way
- 2954 Dunhurst Ct
- 2980 Longridge Way
- 2969 Dunhurst Ct
- 2995 Longridge Way
- 3012 Wynstone Ct
- 4729 Longridge Ct
- 3015 Wynstone Ct
- 3022 Wynstone Ct