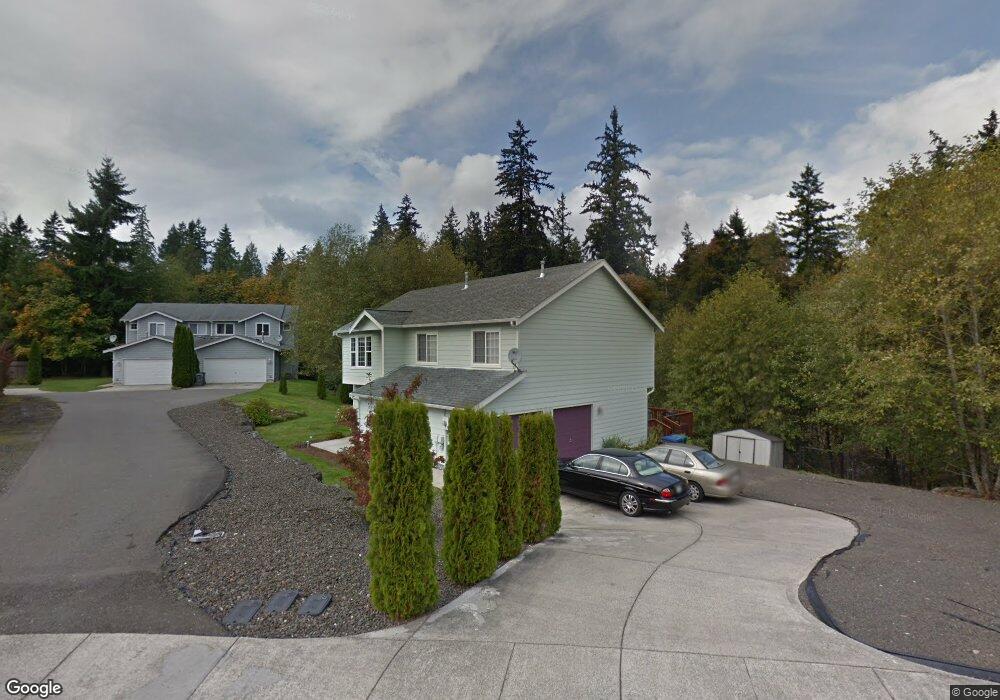
2987 Lowren Loop Port Orchard, WA 98366
Estimated Value: $506,157 - $608,000
4
Beds
3
Baths
2,606
Sq Ft
$204/Sq Ft
Est. Value
About This Home
This home is located at 2987 Lowren Loop, Port Orchard, WA 98366 and is currently estimated at $532,539, approximately $204 per square foot. 2987 Lowren Loop is a home located in Kitsap County with nearby schools including East Port Orchard Elementary School, Marcus Whitman Middle School, and South Kitsap High School.
Ownership History
Date
Name
Owned For
Owner Type
Purchase Details
Closed on
Jul 22, 2016
Sold by
Anderson Kenneth
Bought by
Anderson Kenneth and Kenneth Anderson Trust
Current Estimated Value
Purchase Details
Closed on
Jan 15, 2003
Sold by
Grice Corp
Bought by
Anderson Kenneth
Home Financials for this Owner
Home Financials are based on the most recent Mortgage that was taken out on this home.
Original Mortgage
$165,660
Outstanding Balance
$70,363
Interest Rate
5.96%
Mortgage Type
Purchase Money Mortgage
Estimated Equity
$462,176
Purchase Details
Closed on
Dec 2, 2002
Sold by
Anderson Joann Murray
Bought by
Anderson Kenneth
Home Financials for this Owner
Home Financials are based on the most recent Mortgage that was taken out on this home.
Original Mortgage
$165,660
Outstanding Balance
$70,363
Interest Rate
5.96%
Mortgage Type
Purchase Money Mortgage
Estimated Equity
$462,176
Purchase Details
Closed on
Jun 24, 2002
Sold by
City Bank
Bought by
Grice Corp
Home Financials for this Owner
Home Financials are based on the most recent Mortgage that was taken out on this home.
Original Mortgage
$262,400
Interest Rate
6.86%
Mortgage Type
Seller Take Back
Create a Home Valuation Report for This Property
The Home Valuation Report is an in-depth analysis detailing your home's value as well as a comparison with similar homes in the area
Home Values in the Area
Average Home Value in this Area
Purchase History
| Date | Buyer | Sale Price | Title Company |
|---|---|---|---|
| Anderson Kenneth | $654 | Attorney | |
| Anderson Kenneth | $168,000 | Transnation Title Insurance | |
| Anderson Kenneth | -- | Transnation Title Insurance | |
| Grice Corp | $68,000 | Transnation Title Insurance |
Source: Public Records
Mortgage History
| Date | Status | Borrower | Loan Amount |
|---|---|---|---|
| Open | Anderson Kenneth | $165,660 | |
| Previous Owner | Grice Corp | $262,400 |
Source: Public Records
Tax History Compared to Growth
Tax History
| Year | Tax Paid | Tax Assessment Tax Assessment Total Assessment is a certain percentage of the fair market value that is determined by local assessors to be the total taxable value of land and additions on the property. | Land | Improvement |
|---|---|---|---|---|
| 2026 | $4,011 | $493,420 | $69,040 | $424,380 |
| 2025 | $4,011 | $459,700 | $59,230 | $400,470 |
| 2024 | $3,867 | $459,140 | $59,230 | $399,910 |
| 2023 | $3,864 | $459,140 | $59,230 | $399,910 |
| 2022 | $3,756 | $375,650 | $55,320 | $320,330 |
| 2021 | $3,509 | $332,690 | $51,400 | $281,290 |
| 2020 | $3,446 | $316,840 | $48,950 | $267,890 |
| 2019 | $2,976 | $299,600 | $48,060 | $251,540 |
| 2018 | $3,103 | $240,600 | $48,060 | $192,540 |
| 2017 | $2,636 | $240,600 | $48,060 | $192,540 |
| 2016 | $2,517 | $212,650 | $48,060 | $164,590 |
| 2015 | $2,422 | $207,990 | $48,060 | $159,930 |
| 2014 | -- | $203,330 | $48,060 | $155,270 |
| 2013 | -- | $203,260 | $50,590 | $152,670 |
Source: Public Records
Map
Nearby Homes
- 2949 SE Mile Hill Dr Unit C7
- 2949 SE Mile Hill Dr Unit C-2
- 123 E 4th St
- 4990 Mile Hill Dr
- 1108 Olney Ave E
- 0 Wendell Ave SE
- 740 Tufts Ave E
- 3140 E Washington St
- 22 Lots E Washington St
- 0 E Washington St Unit NWM2337936
- 0 Beach Dr E Unit NWM2139946
- 1355 Ahlstrom Rd E
- 343 Farragut Ave N
- 2017 SE Juniper Ct
- 1663 Harrison Ave SE
- 316 Perry Ave N Unit 1
- 130 Mitchell Ave
- 4010 SE Lovell St
- 2116 Pine Tree Dr SE
- 3900 SE Mile Hill Dr
- 2989 Lowren Loop
- 2979 Lowren Loop
- 2985 Lowren Loop
- 2983 Lowren Loop
- 2983 2985 Lowren St
- 2988 Lowren Loop
- 2981 Lowren Loop
- 2977 Lowren Loop
- 2991 Lowren Loop
- 2980 Lowren Loop
- 2975 Lowren Loop
- 2970 Lowren Loop
- 2990 Lowren Loop
- 2971 Lowren Loop
- 2992 Lowren Loop
- 2973 Lowren Loop
- 2960 Lowren Loop
- 2659 Lowren Loop
- 0 L24 Lowren Loop
- 0 L4 Lowren Loop