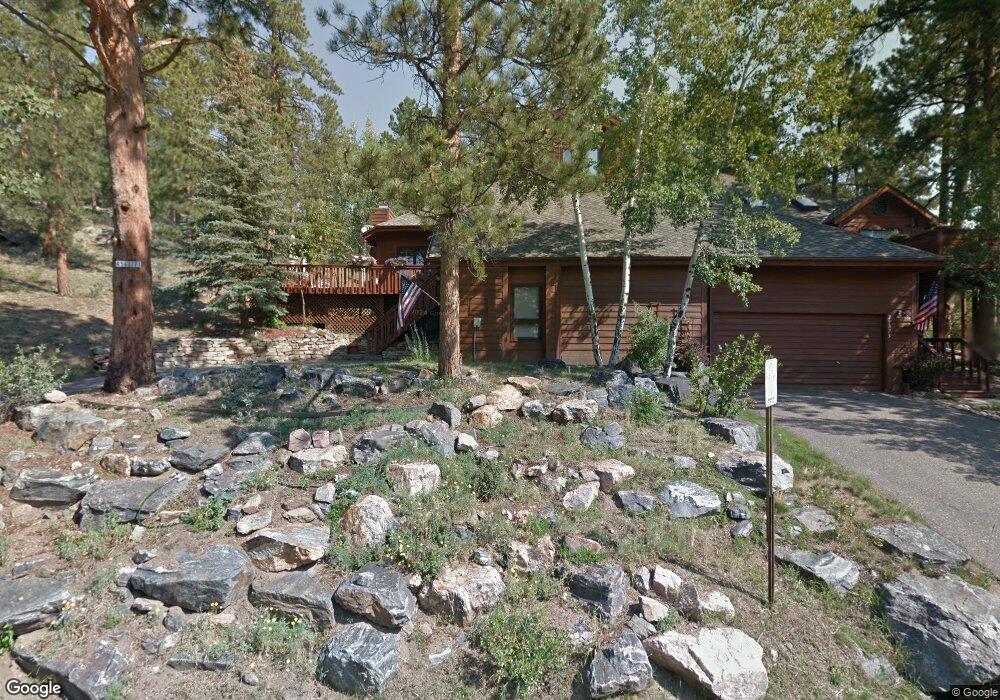
29875 Troutdale Scenic Dr Evergreen, CO 80439
Estimated Value: $775,000 - $885,000
3
Beds
3
Baths
1,854
Sq Ft
$457/Sq Ft
Est. Value
About This Home
This home is located at 29875 Troutdale Scenic Dr, Evergreen, CO 80439 and is currently estimated at $848,109, approximately $457 per square foot. 29875 Troutdale Scenic Dr is a home located in Jefferson County with nearby schools including Bergen Valley Intermediate School, Evergreen Middle School, and Evergreen High School.
Ownership History
Date
Name
Owned For
Owner Type
Purchase Details
Closed on
Apr 21, 2021
Sold by
Wolfe Jack Donald and Wolfe Judith Ann
Bought by
Wolfe Jack Donald and Wolfe Judith Ann
Current Estimated Value
Home Financials for this Owner
Home Financials are based on the most recent Mortgage that was taken out on this home.
Original Mortgage
$250,000
Outstanding Balance
$225,900
Interest Rate
3.05%
Mortgage Type
VA
Estimated Equity
$622,209
Purchase Details
Closed on
Jul 30, 2014
Sold by
Wolfe Jack D and Wolfe Judith A
Bought by
The Jack Donald Wolfe & Judith Ann Wolfe
Purchase Details
Closed on
Aug 7, 2003
Sold by
Reed Mildred H
Bought by
Wolfe Jack D and Wolfe Judith A
Home Financials for this Owner
Home Financials are based on the most recent Mortgage that was taken out on this home.
Original Mortgage
$284,000
Interest Rate
5.24%
Mortgage Type
Unknown
Create a Home Valuation Report for This Property
The Home Valuation Report is an in-depth analysis detailing your home's value as well as a comparison with similar homes in the area
Home Values in the Area
Average Home Value in this Area
Purchase History
| Date | Buyer | Sale Price | Title Company |
|---|---|---|---|
| Wolfe Jack Donald | -- | Closing Usa Llc | |
| The Jack Donald Wolfe & Judith Ann Wolfe | -- | None Available | |
| Wolfe Jack D | $355,000 | -- |
Source: Public Records
Mortgage History
| Date | Status | Borrower | Loan Amount |
|---|---|---|---|
| Open | Wolfe Jack Donald | $250,000 | |
| Closed | Wolfe Jack D | $284,000 | |
| Closed | Wolfe Jack D | $35,500 |
Source: Public Records
Tax History Compared to Growth
Tax History
| Year | Tax Paid | Tax Assessment Tax Assessment Total Assessment is a certain percentage of the fair market value that is determined by local assessors to be the total taxable value of land and additions on the property. | Land | Improvement |
|---|---|---|---|---|
| 2024 | $3,755 | $47,639 | $9,719 | $37,920 |
| 2023 | $3,755 | $47,639 | $9,719 | $37,920 |
| 2022 | $3,235 | $41,194 | $10,060 | $31,134 |
| 2021 | $3,269 | $42,380 | $10,350 | $32,030 |
| 2020 | $2,811 | $37,217 | $11,772 | $25,445 |
| 2019 | $2,772 | $37,217 | $11,772 | $25,445 |
| 2018 | $2,526 | $33,703 | $8,076 | $25,627 |
| 2017 | $2,300 | $33,703 | $8,076 | $25,627 |
| 2016 | $2,310 | $32,090 | $10,264 | $21,826 |
| 2015 | $1,908 | $32,090 | $10,264 | $21,826 |
| 2014 | $1,908 | $27,315 | $9,851 | $17,464 |
Source: Public Records
Map
Nearby Homes
- 29862 Troutdale Park Place
- 3942 S Palo Verde Rd
- 3909 Piney Grove St
- 3907 Piney Grove St
- 3899 Piney Grove St
- 3897 Piney Grove St
- 3889 Bahn Ct
- 3833 Whispering Sage St
- 3887 Bahn Ct
- 3879 Bahn Ct
- 3877 Bahn Ct
- 3828 Piney Grove St
- 3826 Piney Grove St
- 28964 Western Dr
- 30174 Glen Eyrie Dr
- 3661 Joyful Way Unit D
- 28609 Pine Dr
- 4148 Timbervale Dr
- 28525 Evergreen Manor Dr
- 28449 Douglas Park Rd
- 29873 Troutdale Scenic Dr
- 29921 Troutdale Ridge Rd
- 30103 Troutdale Scenic Dr
- 29854 Park Village Dr
- 29853 Troutdale Scenic Dr
- 29855 Park Village Dr
- 29856 Park Village Dr
- 29931 Troutdale Ridge Rd
- 4206 Troutdale Village Dr
- 29859 Park Village Dr
- 4238 Scenic Village Dr
- 4216 Troutdale Village Dr
- 29858 Park Village Dr
- 29842 Troutdale Scenic Dr
- 4229 Scenic Village Dr
- 29950 Troutdale Scenic Dr
- 29861 Park Village Dr
- 29860 Park Village Dr
- 4248 Scenic Village Dr
- 4226 Troutdale Village Dr