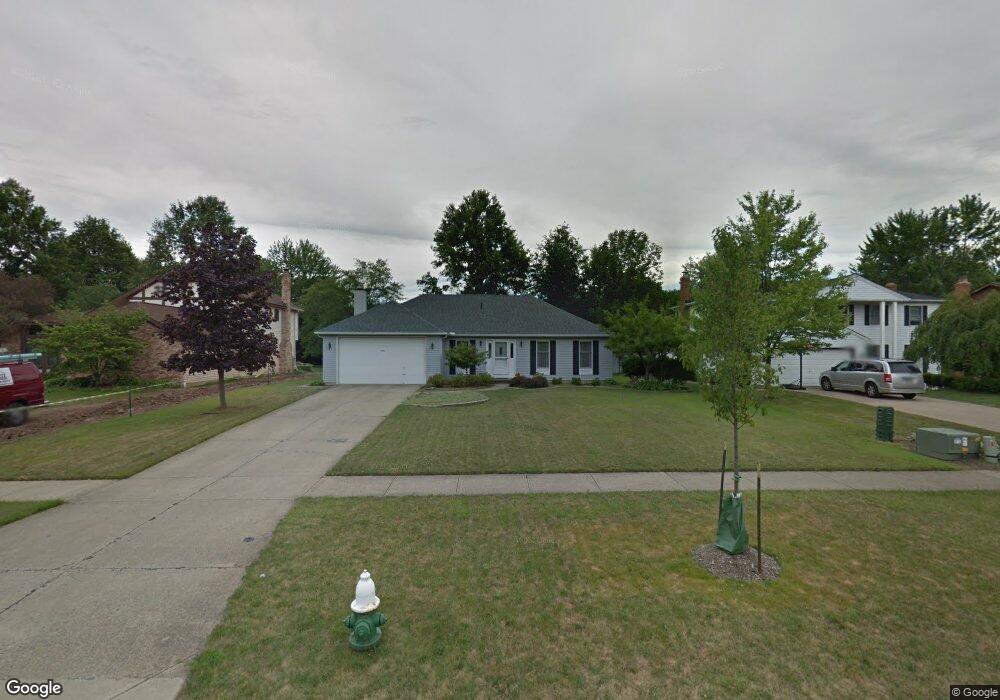
29895 Sequoia Trail Westlake, OH 44145
Estimated Value: $459,216 - $594,000
2
Beds
3
Baths
2,160
Sq Ft
$241/Sq Ft
Est. Value
About This Home
This home is located at 29895 Sequoia Trail, Westlake, OH 44145 and is currently estimated at $520,304, approximately $240 per square foot. 29895 Sequoia Trail is a home located in Cuyahoga County with nearby schools including Dover Intermediate School, Lee Burneson Middle School, and Westlake High School.
Ownership History
Date
Name
Owned For
Owner Type
Purchase Details
Closed on
Aug 11, 2003
Sold by
Daw Timothy M
Bought by
Papadorotheou Athanasios N and Papadorotheou Anna A
Current Estimated Value
Home Financials for this Owner
Home Financials are based on the most recent Mortgage that was taken out on this home.
Original Mortgage
$173,000
Outstanding Balance
$74,460
Interest Rate
5.31%
Mortgage Type
Purchase Money Mortgage
Estimated Equity
$445,844
Purchase Details
Closed on
Apr 3, 2001
Sold by
Daw Adelaine M
Bought by
Daw Timothy M
Purchase Details
Closed on
Jan 7, 1992
Sold by
Daw William B
Bought by
Daw William B
Purchase Details
Closed on
May 22, 1986
Bought by
Daw William B
Purchase Details
Closed on
Feb 5, 1985
Bought by
Bennett Contractors Inc
Purchase Details
Closed on
Jun 21, 1982
Bought by
Olympus Homes Inc
Purchase Details
Closed on
Aug 6, 1981
Bought by
Andreano Carl S Trs
Purchase Details
Closed on
Jan 1, 1979
Bought by
Bretton Woods Park Inc
Create a Home Valuation Report for This Property
The Home Valuation Report is an in-depth analysis detailing your home's value as well as a comparison with similar homes in the area
Home Values in the Area
Average Home Value in this Area
Purchase History
| Date | Buyer | Sale Price | Title Company |
|---|---|---|---|
| Papadorotheou Athanasios N | $214,000 | Chicago Title Insurance Co | |
| Daw Timothy M | -- | -- | |
| Daw William B | -- | -- | |
| Daw William B | $131,100 | -- | |
| Bennett Contractors Inc | -- | -- | |
| Olympus Homes Inc | -- | -- | |
| Andreano Carl S Trs | -- | -- | |
| Bretton Woods Park Inc | -- | -- |
Source: Public Records
Mortgage History
| Date | Status | Borrower | Loan Amount |
|---|---|---|---|
| Open | Papadorotheou Athanasios N | $173,000 |
Source: Public Records
Tax History Compared to Growth
Tax History
| Year | Tax Paid | Tax Assessment Tax Assessment Total Assessment is a certain percentage of the fair market value that is determined by local assessors to be the total taxable value of land and additions on the property. | Land | Improvement |
|---|---|---|---|---|
| 2024 | $6,730 | $142,065 | $32,760 | $109,305 |
| 2023 | $5,741 | $103,600 | $26,460 | $77,140 |
| 2022 | $5,649 | $103,600 | $26,460 | $77,140 |
| 2021 | $5,656 | $103,600 | $26,460 | $77,140 |
| 2020 | $5,710 | $95,940 | $24,500 | $71,440 |
| 2019 | $5,536 | $274,100 | $70,000 | $204,100 |
| 2018 | $5,015 | $95,940 | $24,500 | $71,440 |
| 2017 | $5,415 | $87,860 | $19,290 | $68,570 |
| 2016 | $5,386 | $87,860 | $19,290 | $68,570 |
| 2015 | $5,326 | $87,860 | $19,290 | $68,570 |
| 2014 | $5,326 | $85,300 | $18,730 | $66,570 |
Source: Public Records
Map
Nearby Homes
- 4340 Palomar Cir
- 4340 Palomar Ln
- ABBY TH Plan at Brentwood - Brentwood Townhomes
- LUCAS TH Plan at Brentwood - Brentwood Townhomes
- LIBBY TH Plan at Brentwood - Brentwood Townhomes
- 4352 Palomar Cir
- 4324 Palomar Ln
- 29852 Lenox Dr
- 30029 Shadow Creek Dr Unit 34
- 30233 Center Ridge Rd Unit 5
- S/L A Mallard Cove
- S/L Y Carlton Ave
- S/L Carlton Ave
- 30492 Carlton Ave
- 29647 Indian Ridge Cove
- 29458 Hummingbird Cir Unit 71
- Lyon Plan at Carlton Estates
- Bourges Plan at Carlton Estates
- Deer Valley Plan at Carlton Estates
- Woodside Plan at Carlton Estates
- 29885 Sequoia Trail
- 29905 Sequoia Trail
- 105 Sequoia Trail
- 103 Sequoia Trail
- 29915 Sequoia Trail
- 29875 Sequoia Trail
- 29916 Sycamore Oval
- 29932 Sycamore Oval
- 29935 Sequoia Trail
- 29865 Sequoia Trail
- 29900 Sequoia Trail
- 29890 Sequoia Trail
- 29910 Sequoia Trail
- 29948 Sycamore Oval
- 29880 Sequoia Trail
- 29920 Sequoia Trail
- 29904 Sycamore Oval
- 29955 Sequoia Trail
- 29855 Sequoia Trail
- 29870 Sequoia Trail