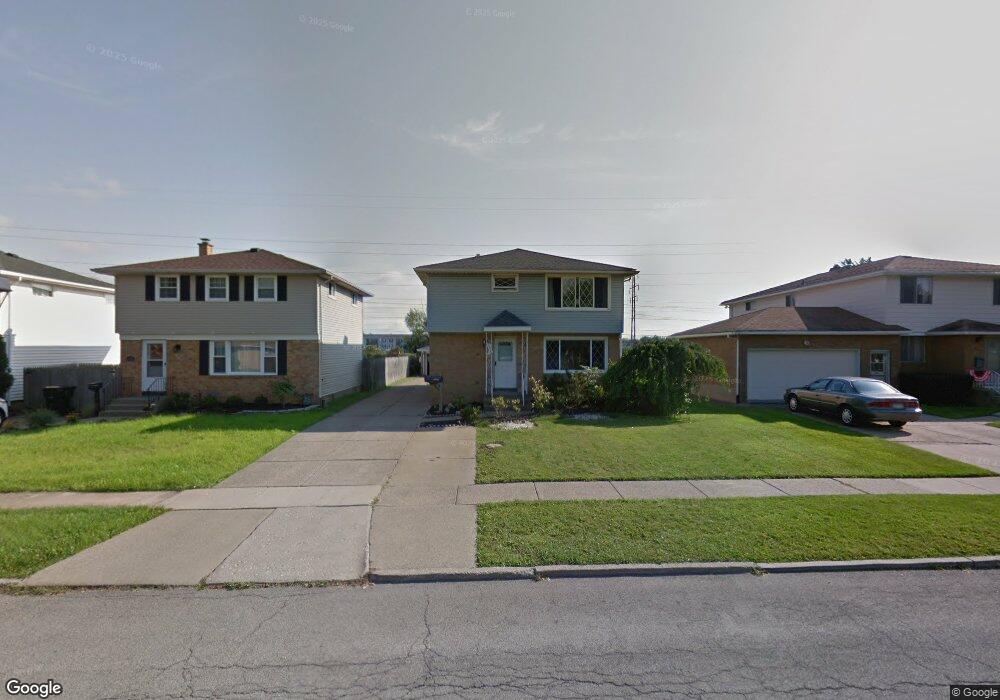
299 Joseph Dr Tonawanda, NY 14150
Estimated Value: $316,000 - $349,000
6
Beds
3
Baths
2,636
Sq Ft
$128/Sq Ft
Est. Value
About This Home
This home is located at 299 Joseph Dr, Tonawanda, NY 14150 and is currently estimated at $337,746, approximately $128 per square foot. 299 Joseph Dr is a home located in Erie County with nearby schools including Thomas A. Edison Elementary School, Ben Franklin Middle School, and Kenmore East Senior High School.
Ownership History
Date
Name
Owned For
Owner Type
Purchase Details
Closed on
Jul 2, 2009
Sold by
Watt Michael J
Bought by
Desirable Rentals Llc
Current Estimated Value
Purchase Details
Closed on
Feb 24, 2009
Sold by
Salamone Frank D
Bought by
Watt Michael J
Home Financials for this Owner
Home Financials are based on the most recent Mortgage that was taken out on this home.
Original Mortgage
$103,500
Interest Rate
5.14%
Mortgage Type
New Conventional
Create a Home Valuation Report for This Property
The Home Valuation Report is an in-depth analysis detailing your home's value as well as a comparison with similar homes in the area
Home Values in the Area
Average Home Value in this Area
Purchase History
| Date | Buyer | Sale Price | Title Company |
|---|---|---|---|
| Desirable Rentals Llc | -- | None Available | |
| Watt Michael J | $115,000 | None Available |
Source: Public Records
Mortgage History
| Date | Status | Borrower | Loan Amount |
|---|---|---|---|
| Previous Owner | Watt Michael J | $103,500 |
Source: Public Records
Tax History Compared to Growth
Tax History
| Year | Tax Paid | Tax Assessment Tax Assessment Total Assessment is a certain percentage of the fair market value that is determined by local assessors to be the total taxable value of land and additions on the property. | Land | Improvement |
|---|---|---|---|---|
| 2024 | $8,041 | $65,000 | $9,500 | $55,500 |
| 2023 | $7,864 | $65,000 | $9,500 | $55,500 |
| 2022 | $7,432 | $65,000 | $9,500 | $55,500 |
| 2021 | $7,405 | $65,000 | $9,500 | $55,500 |
| 2020 | $6,261 | $65,000 | $9,500 | $55,500 |
| 2019 | $6,105 | $65,000 | $9,500 | $55,500 |
| 2018 | $6,073 | $65,000 | $9,500 | $55,500 |
| 2017 | $2,473 | $65,000 | $9,500 | $55,500 |
| 2016 | $5,828 | $65,000 | $9,500 | $55,500 |
| 2015 | -- | $65,000 | $9,500 | $55,500 |
| 2014 | -- | $65,000 | $9,500 | $55,500 |
Source: Public Records
Map
Nearby Homes