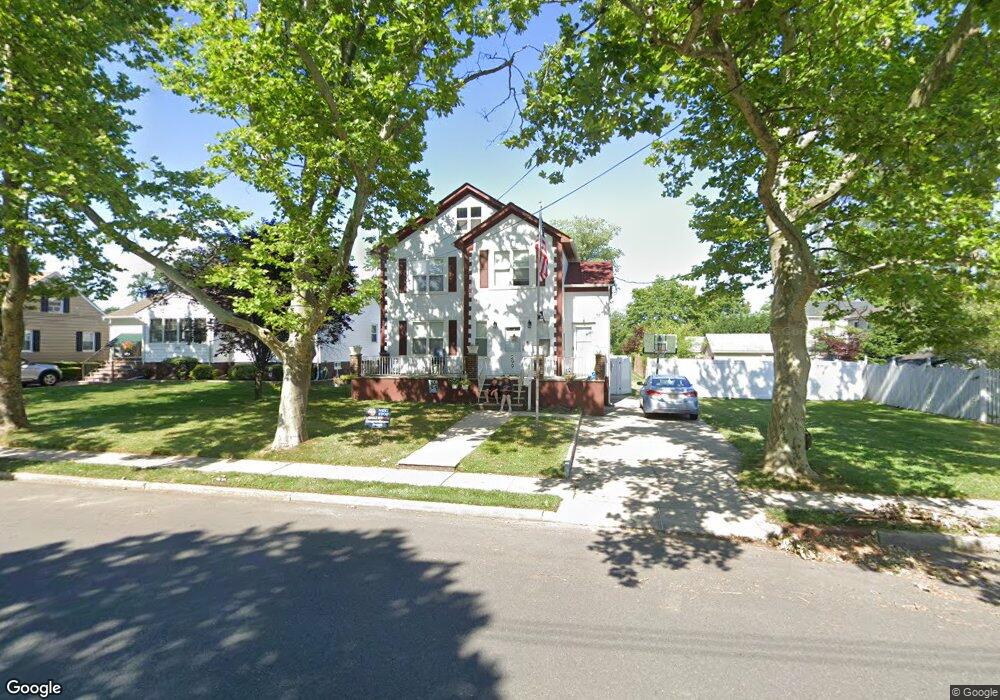
299 Main St Keyport, NJ 07735
Estimated Value: $542,266 - $607,000
5
Beds
2
Baths
1,817
Sq Ft
$316/Sq Ft
Est. Value
About This Home
This home is located at 299 Main St, Keyport, NJ 07735 and is currently estimated at $573,817, approximately $315 per square foot. 299 Main St is a home located in Monmouth County with nearby schools including Keyport Central School, Keyport High School, and Icob Academy.
Ownership History
Date
Name
Owned For
Owner Type
Purchase Details
Closed on
Feb 10, 2022
Sold by
Ann Reed Lissa
Bought by
Reed Lissa Ann
Current Estimated Value
Purchase Details
Closed on
Feb 20, 2019
Sold by
Mangini Joseph J
Bought by
Mangini Carmine A and Reed Lissa Ann
Purchase Details
Closed on
Sep 14, 1992
Bought by
Mangini Carmine Joseph Phil and Mangini Reed L
Create a Home Valuation Report for This Property
The Home Valuation Report is an in-depth analysis detailing your home's value as well as a comparison with similar homes in the area
Home Values in the Area
Average Home Value in this Area
Purchase History
| Date | Buyer | Sale Price | Title Company |
|---|---|---|---|
| Reed Lissa Ann | -- | Kantor Lawrence D | |
| Mangini Carmine A | -- | None Available | |
| Mangini Carmine Joseph Phil | -- | -- |
Source: Public Records
Tax History
| Year | Tax Paid | Tax Assessment Tax Assessment Total Assessment is a certain percentage of the fair market value that is determined by local assessors to be the total taxable value of land and additions on the property. | Land | Improvement |
|---|---|---|---|---|
| 2025 | $9,342 | $477,400 | $224,100 | $253,300 |
| 2024 | $8,682 | $451,300 | $210,500 | $240,800 |
| 2023 | $8,682 | $395,000 | $191,400 | $203,600 |
| 2022 | $7,872 | $343,400 | $166,400 | $177,000 |
| 2021 | $7,872 | $311,900 | $148,600 | $163,300 |
| 2020 | $7,601 | $298,900 | $143,600 | $155,300 |
| 2019 | $7,381 | $290,700 | $138,900 | $151,800 |
| 2018 | $6,952 | $267,400 | $125,400 | $142,000 |
| 2017 | $7,579 | $290,700 | $125,400 | $165,300 |
| 2016 | $7,016 | $271,400 | $125,400 | $146,000 |
| 2015 | $6,999 | $269,500 | $125,400 | $144,100 |
| 2014 | $8,182 | $318,100 | $116,400 | $201,700 |
Source: Public Records
Map
Nearby Homes
- 231 Atlantic St Unit 23
- 231 Atlantic St Unit 83
- 9 Hurley St
- 226 Osborn St
- 6 Octavia Place
- 81 Village Green Way
- 155 Luppatatong Ave
- 104 Church St
- 72 Manchester Ave
- 173 Village Green Way
- 74 Manchester Ave
- 9 Kearney St Unit A
- 87 Church St
- 5 Barrier Dr
- 2108 Florence Ave
- 75 Broad St
- 253 Broadway
- 40 Church St
- 2 Chingarora Ave
- 138 3rd St
Your Personal Tour Guide
Ask me questions while you tour the home.