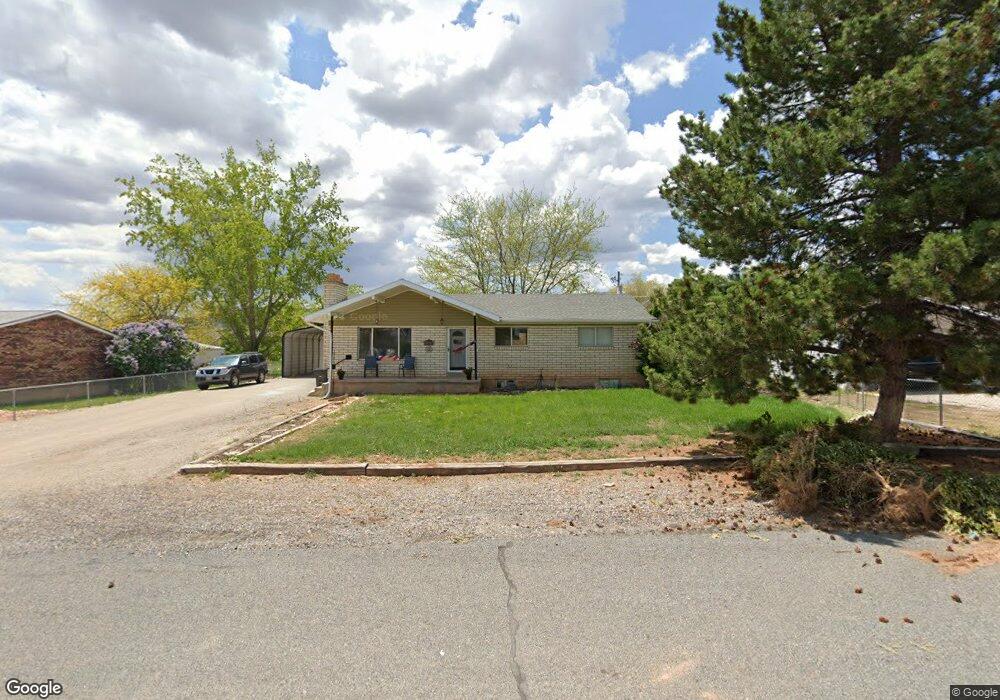
299 N 300 W Aurora, UT 84620
Estimated Value: $366,000 - $425,000
6
Beds
2
Baths
2,576
Sq Ft
$153/Sq Ft
Est. Value
About This Home
This home is located at 299 N 300 W, Aurora, UT 84620 and is currently estimated at $393,197, approximately $152 per square foot. 299 N 300 W is a home located in Sevier County with nearby schools including Salina School, North Sevier Middle School, and North Sevier High School.
Ownership History
Date
Name
Owned For
Owner Type
Purchase Details
Closed on
Sep 1, 2022
Sold by
Sullivan Tyler D
Bought by
Nuttall Branden and Nuttall David
Current Estimated Value
Home Financials for this Owner
Home Financials are based on the most recent Mortgage that was taken out on this home.
Original Mortgage
$316,000
Outstanding Balance
$302,589
Interest Rate
5.54%
Mortgage Type
New Conventional
Estimated Equity
$90,608
Purchase Details
Closed on
Jun 25, 2021
Sold by
Sullivan Tyler D
Bought by
Sullivan Tyler D and Sullivan Mellissa
Home Financials for this Owner
Home Financials are based on the most recent Mortgage that was taken out on this home.
Original Mortgage
$219,780
Interest Rate
2.9%
Mortgage Type
FHA
Purchase Details
Closed on
Sep 27, 2018
Sold by
Mcbride Lamar and Mcbride Kristine
Bought by
Sullivan Tyler D
Home Financials for this Owner
Home Financials are based on the most recent Mortgage that was taken out on this home.
Original Mortgage
$178,997
Interest Rate
5.25%
Mortgage Type
FHA
Create a Home Valuation Report for This Property
The Home Valuation Report is an in-depth analysis detailing your home's value as well as a comparison with similar homes in the area
Home Values in the Area
Average Home Value in this Area
Purchase History
| Date | Buyer | Sale Price | Title Company |
|---|---|---|---|
| Nuttall Branden | -- | First American Title | |
| Sullivan Tyler D | -- | Backman Title Services Ltd | |
| Sullivan Tyler D | -- | First American Title |
Source: Public Records
Mortgage History
| Date | Status | Borrower | Loan Amount |
|---|---|---|---|
| Open | Nuttall Branden | $316,000 | |
| Previous Owner | Sullivan Tyler D | $219,780 | |
| Previous Owner | Sullivan Tyler D | $178,997 |
Source: Public Records
Tax History Compared to Growth
Tax History
| Year | Tax Paid | Tax Assessment Tax Assessment Total Assessment is a certain percentage of the fair market value that is determined by local assessors to be the total taxable value of land and additions on the property. | Land | Improvement |
|---|---|---|---|---|
| 2024 | $1,430 | $181,006 | $33,113 | $147,893 |
| 2023 | $1,605 | $186,419 | $30,888 | $155,531 |
| 2022 | $1,547 | $155,221 | $27,606 | $127,615 |
| 2021 | $1,356 | $112,999 | $18,480 | $94,519 |
| 2020 | $1,171 | $91,739 | $18,480 | $73,259 |
| 2019 | $1,068 | $89,380 | $18,480 | $70,900 |
| 2018 | $931 | $69,200 | $15,840 | $53,360 |
| 2017 | $925 | $65,680 | $15,840 | $49,840 |
| 2016 | $757 | $61,760 | $0 | $0 |
| 2015 | $757 | $61,760 | $0 | $0 |
| 2014 | $757 | $63,220 | $0 | $0 |
Source: Public Records
Map
Nearby Homes
- 390 N 300 W
- 770 N 300 W Unit 102
- 675 N 300 W Unit 111
- 695 N 300 W Unit 112
- 725 N 300 W Unit 113
- 750 N 300 W Unit 101
- 70 N Main
- 122 S 500 W
- 330 W 800 S Unit 105
- 680 E 300 S Unit 110
- 310 W 800 S Unit 106
- 2200 N Hwy 260 (Approximately) W
- 2203 S 1770 W Unit 1
- 79 S 250 E
- 305 E 2690 N
- 2220 N State St Unit 14
- 375 W Sandy Ln
- 325 Cobble St
- 630 W 285 N
- 268 N Salina Creek Dr