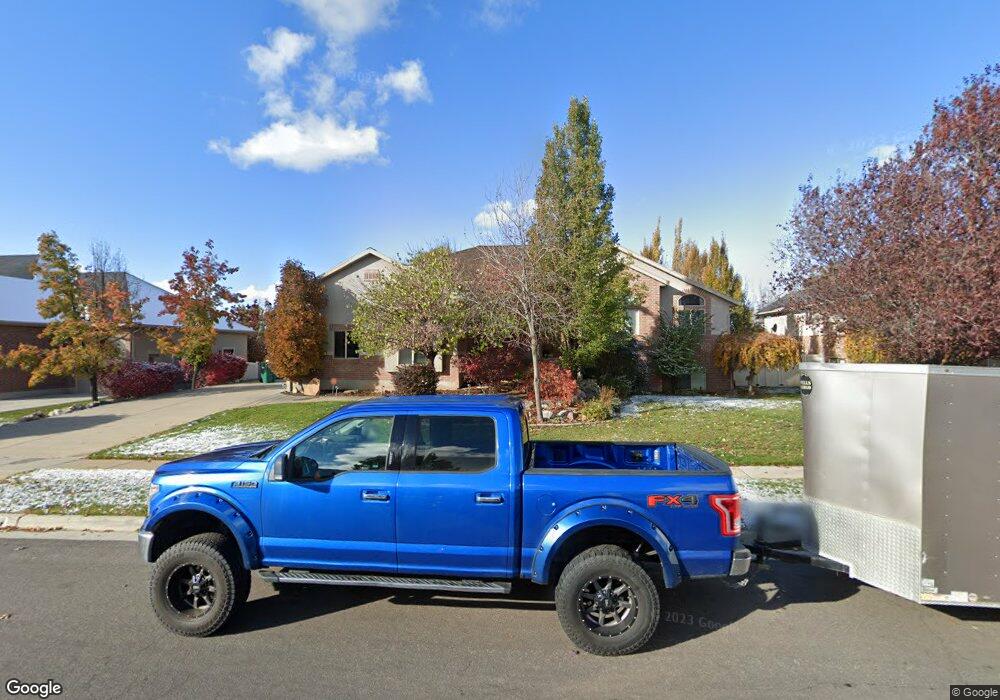
299 N 3050 W Layton, UT 84041
Estimated Value: $774,000 - $821,000
6
Beds
4
Baths
3,920
Sq Ft
$202/Sq Ft
Est. Value
About This Home
This home is located at 299 N 3050 W, Layton, UT 84041 and is currently estimated at $793,719, approximately $202 per square foot. 299 N 3050 W is a home located in Davis County with nearby schools including Sand Springs Elementary School, Legacy Junior High School, and Layton High School.
Ownership History
Date
Name
Owned For
Owner Type
Purchase Details
Closed on
Jul 29, 2025
Sold by
Ahern Ryan and Ahern Christine
Bought by
Ryan And Christine Ahern Living Trust and Ahern
Current Estimated Value
Purchase Details
Closed on
Jun 2, 2021
Sold by
Feil Shauna M
Bought by
Ahern Ryan and Ahern Christine
Home Financials for this Owner
Home Financials are based on the most recent Mortgage that was taken out on this home.
Original Mortgage
$700,000
Interest Rate
2.9%
Mortgage Type
VA
Purchase Details
Closed on
Feb 27, 2015
Sold by
Leopardi Thomas P
Bought by
Leopardi Shauna M
Purchase Details
Closed on
Sep 23, 2003
Sold by
Mountain Green Development Llc
Bought by
Leopardi Thomas P and Leopardi Shauna M
Create a Home Valuation Report for This Property
The Home Valuation Report is an in-depth analysis detailing your home's value as well as a comparison with similar homes in the area
Home Values in the Area
Average Home Value in this Area
Purchase History
| Date | Buyer | Sale Price | Title Company |
|---|---|---|---|
| Ryan And Christine Ahern Living Trust | -- | None Listed On Document | |
| Ryan And Christine Ahern Living Trust | -- | None Listed On Document | |
| Ahern Ryan | -- | Investors Title Insurance | |
| Leopardi Shauna M | -- | None Available | |
| Leopardi Thomas P | -- | Bonneville Title Company Inc |
Source: Public Records
Mortgage History
| Date | Status | Borrower | Loan Amount |
|---|---|---|---|
| Previous Owner | Ahern Ryan | $700,000 |
Source: Public Records
Tax History Compared to Growth
Tax History
| Year | Tax Paid | Tax Assessment Tax Assessment Total Assessment is a certain percentage of the fair market value that is determined by local assessors to be the total taxable value of land and additions on the property. | Land | Improvement |
|---|---|---|---|---|
| 2025 | -- | $414,701 | $137,055 | $277,646 |
| 2024 | $0 | $418,550 | $145,704 | $272,846 |
| 2023 | $1,858 | $713,000 | $156,235 | $556,765 |
| 2022 | $1,858 | $415,250 | $89,596 | $325,654 |
| 2021 | $888 | $535,000 | $134,364 | $400,636 |
| 2020 | $3,245 | $470,000 | $115,175 | $354,825 |
| 2019 | $3,159 | $448,000 | $112,946 | $335,054 |
| 2018 | $2,922 | $416,000 | $99,632 | $316,368 |
| 2016 | $2,731 | $200,585 | $41,842 | $158,743 |
| 2015 | $2,529 | $176,385 | $41,842 | $134,543 |
| 2014 | $2,178 | $155,289 | $41,842 | $113,447 |
| 2013 | -- | $156,869 | $41,383 | $115,486 |
Source: Public Records
Map
Nearby Homes