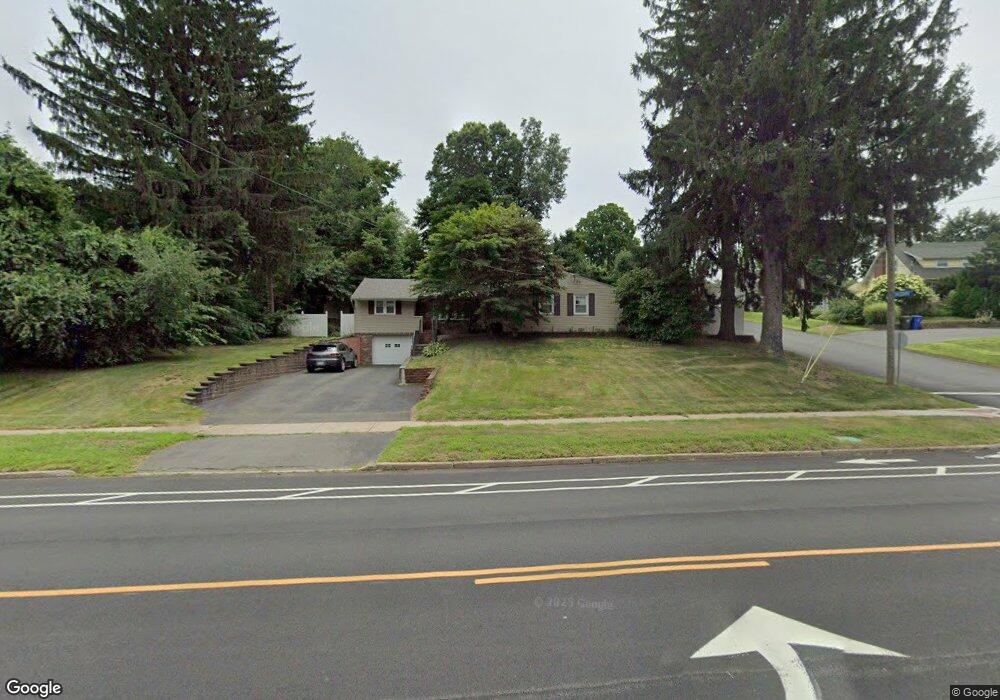
299 Robbins Ave Newington, CT 06111
Estimated Value: $364,000 - $414,648
3
Beds
2
Baths
1,142
Sq Ft
$350/Sq Ft
Est. Value
About This Home
This home is located at 299 Robbins Ave, Newington, CT 06111 and is currently estimated at $400,162, approximately $350 per square foot. 299 Robbins Ave is a home located in Hartford County with nearby schools including John Paterson School, John Wallace Middle School, and Newington High School.
Ownership History
Date
Name
Owned For
Owner Type
Purchase Details
Closed on
May 18, 2001
Sold by
Deplante Michael E and Deplante Tania T
Bought by
Ursal Bernard and Ursal Rosanna
Current Estimated Value
Purchase Details
Closed on
Apr 20, 1989
Sold by
Bolduc Richard M
Bought by
Deplante Michael E
Purchase Details
Closed on
Jan 20, 1988
Sold by
Bolduc Richard M
Bought by
Deplante Michael E
Create a Home Valuation Report for This Property
The Home Valuation Report is an in-depth analysis detailing your home's value as well as a comparison with similar homes in the area
Home Values in the Area
Average Home Value in this Area
Purchase History
| Date | Buyer | Sale Price | Title Company |
|---|---|---|---|
| Ursal Bernard | $162,000 | -- | |
| Deplante Michael E | $172,000 | -- | |
| Deplante Michael E | $172,000 | -- |
Source: Public Records
Mortgage History
| Date | Status | Borrower | Loan Amount |
|---|---|---|---|
| Open | Deplante Michael E | $50,000 | |
| Closed | Deplante Michael E | $157,200 | |
| Closed | Deplante Michael E | $159,000 |
Source: Public Records
Tax History Compared to Growth
Tax History
| Year | Tax Paid | Tax Assessment Tax Assessment Total Assessment is a certain percentage of the fair market value that is determined by local assessors to be the total taxable value of land and additions on the property. | Land | Improvement |
|---|---|---|---|---|
| 2025 | $6,069 | $151,800 | $56,780 | $95,020 |
| 2024 | $6,022 | $151,800 | $56,780 | $95,020 |
| 2023 | $5,786 | $150,840 | $56,790 | $94,050 |
| 2022 | $5,806 | $150,840 | $56,790 | $94,050 |
| 2021 | $5,854 | $150,840 | $56,790 | $94,050 |
| 2020 | $5,692 | $144,920 | $54,600 | $90,320 |
| 2019 | $5,717 | $144,920 | $54,600 | $90,320 |
| 2018 | $5,579 | $144,920 | $54,600 | $90,320 |
| 2017 | $5,303 | $144,920 | $54,600 | $90,320 |
| 2016 | $5,181 | $144,920 | $54,600 | $90,320 |
| 2014 | $4,600 | $132,300 | $54,240 | $78,060 |
Source: Public Records
Map
Nearby Homes
- 263 Robbins Ave
- 340 Robbins Ave
- 36 Sequin St
- 76 Clifford St
- 129 Glenview Dr
- 31 Henry Ave
- 11 Eleanor Place
- 193 Hillcrest Ave
- 5 Copper Beech Ln
- 31 Fox Run Ct Unit 31
- 149 Foxboro Dr Unit 149
- 120 Fox Run Ct
- 107 Fox Run Ct Unit 107
- 170 Church St
- 760 Willard Ave
- 162 Buena Vista Ave
- 43 Steeplechase Dr Unit 43
- 160 Buena Vista Ave
- 21 7th St
- 137 Superior Ave
- 18 Theodore St
- 287 Robbins Ave
- 34 Hillside St
- 315 Robbins Ave
- 9 Theodore St
- 30 Hillside St
- 300 Robbins Ave
- 306 Robbins Ave
- 26 Hillside St
- 279 Robbins Ave
- 294 Robbins Ave
- 23 Theodore St
- 28 Theodore St
- 314 Robbins Ave
- 22 Hillside St
- 29 Theodore St
- 3 Homecrest St
- 323 Robbins Ave
- 16 Frederick St
- 18 Hillside St