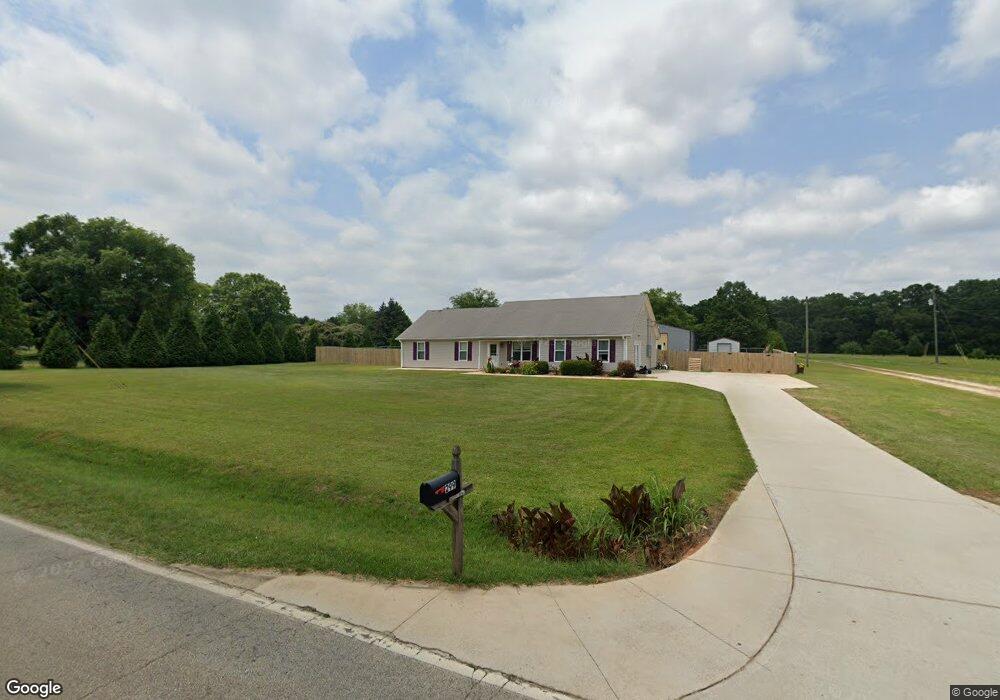
299 Snapping Shoals Rd McDonough, GA 30252
Estimated Value: $254,000 - $276,000
3
Beds
2
Baths
1,492
Sq Ft
$178/Sq Ft
Est. Value
About This Home
This home is located at 299 Snapping Shoals Rd, McDonough, GA 30252 and is currently estimated at $265,625, approximately $178 per square foot. 299 Snapping Shoals Rd is a home located in Henry County with nearby schools including Ola Elementary School, Ola Middle School, and Ola High School.
Ownership History
Date
Name
Owned For
Owner Type
Purchase Details
Closed on
Jul 16, 2020
Sold by
Hail Wanda K
Bought by
Groover Jerrell and Groover Christina
Current Estimated Value
Home Financials for this Owner
Home Financials are based on the most recent Mortgage that was taken out on this home.
Original Mortgage
$150,000
Outstanding Balance
$133,010
Interest Rate
3.1%
Mortgage Type
New Conventional
Estimated Equity
$132,615
Purchase Details
Closed on
Dec 10, 2019
Sold by
Hail Willie G
Bought by
Hail Wanda K
Purchase Details
Closed on
Sep 17, 2007
Sold by
Deutsche Bk Natl Trust Co
Bought by
Hail Willie G
Purchase Details
Closed on
Oct 3, 2006
Sold by
Larson Earl and Larson Opel
Bought by
Deutsche Bk Natl Trust Co
Purchase Details
Closed on
Oct 19, 2004
Sold by
Toohill Elizabeth M
Bought by
Larson Earl and Larson Opel
Home Financials for this Owner
Home Financials are based on the most recent Mortgage that was taken out on this home.
Original Mortgage
$113,525
Interest Rate
5.87%
Mortgage Type
New Conventional
Create a Home Valuation Report for This Property
The Home Valuation Report is an in-depth analysis detailing your home's value as well as a comparison with similar homes in the area
Home Values in the Area
Average Home Value in this Area
Purchase History
| Date | Buyer | Sale Price | Title Company |
|---|---|---|---|
| Groover Jerrell | $170,000 | -- | |
| Hail Wanda K | -- | -- | |
| Hail Willie G | $60,000 | -- | |
| Deutsche Bk Natl Trust Co | $105,145 | -- | |
| Larson Earl | $119,500 | -- |
Source: Public Records
Mortgage History
| Date | Status | Borrower | Loan Amount |
|---|---|---|---|
| Open | Groover Jerrell | $150,000 | |
| Previous Owner | Larson Earl | $113,525 |
Source: Public Records
Tax History Compared to Growth
Tax History
| Year | Tax Paid | Tax Assessment Tax Assessment Total Assessment is a certain percentage of the fair market value that is determined by local assessors to be the total taxable value of land and additions on the property. | Land | Improvement |
|---|---|---|---|---|
| 2025 | $4,139 | $112,600 | $15,360 | $97,240 |
| 2024 | $4,139 | $110,480 | $14,320 | $96,160 |
| 2023 | $4,330 | $111,840 | $13,760 | $98,080 |
| 2022 | $3,383 | $87,160 | $12,720 | $74,440 |
| 2021 | $2,648 | $68,000 | $10,200 | $57,800 |
| 2020 | $2,495 | $64,000 | $10,280 | $53,720 |
| 2019 | $2,314 | $59,280 | $9,760 | $49,520 |
| 2018 | $2,113 | $54,040 | $9,000 | $45,040 |
| 2016 | $1,723 | $43,880 | $6,680 | $37,200 |
| 2015 | $1,706 | $42,120 | $7,520 | $34,600 |
| 2014 | -- | $34,000 | $7,520 | $26,480 |
Source: Public Records
Map
Nearby Homes
- 572 N Ola Rd
- 323 Snapping Shoals Rd
- 100 Tapestry Dr
- 156 Tapestry Dr
- 504 Liverpool Dr
- 617 Elsa Ln Unit 78
- 617 Elsa Ln
- 264 Arwen Dr
- 264 Arwen Dr Unit 125
- 268 Arwen Dr Unit LOT 124
- 268 Arwen Dr
- 272 Arwen Dr Unit LOT 123
- 272 Arwen Dr
- 276 Arwen Dr Unit LOT 122
- 276 Arwen Dr
- 280 Arwen Dr Unit LOT 121
- 280 Arwen Dr
- 288 Arwen Dr Unit LOT 119
- 288 Arwen Dr
- 296 Arwen Dr
- 295 Snapping Shoals Rd
- 305 Snapping Shoals Rd
- 297 Snapping Shoals Rd
- 80 Snapping Shoals Rd
- 86 Snapping Shoals Rd
- 76 Snapping Shoals Rd
- 88 Snapping Shoals Rd
- 309 Snapping Shoals Rd
- 293 Snapping Shoals Rd
- 293 Snapping Shoals Rd Unit 5
- 289 Snapping Shoals Rd
- 74 Snapping Shoals Rd
- 574 N Ola Rd
- 287 Snapping Shoals Rd
- 315 Snapping Shoals Rd
- 72 Snapping Shoals Rd
- 311 Snapping Shoals Rd
- 311 Snapping Shoals Rd Unit Tract E
- 291 Snapping Shoals Rd Unit 2+ ACRES
- 291 Snapping Shoals Rd