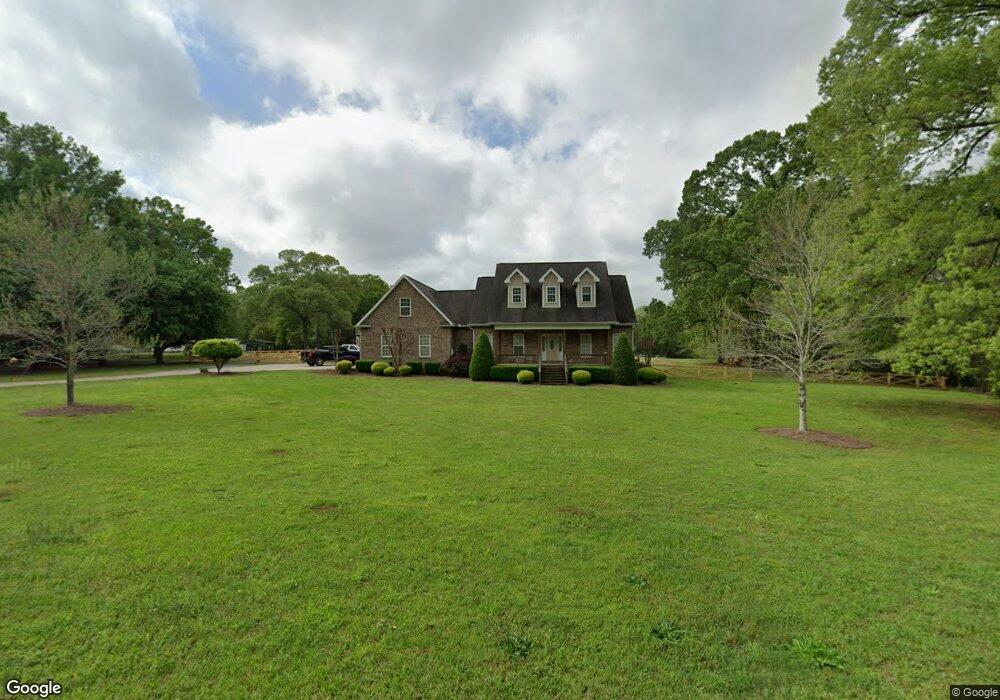
299 Sylvan Dr Kathleen, GA 31047
Estimated Value: $266,000 - $437,836
4
Beds
3
Baths
2,367
Sq Ft
$156/Sq Ft
Est. Value
About This Home
This home is located at 299 Sylvan Dr, Kathleen, GA 31047 and is currently estimated at $368,612, approximately $155 per square foot. 299 Sylvan Dr is a home located in Houston County with nearby schools including Bonaire Elementary School, Bonaire Middle School, and Veterans High School.
Ownership History
Date
Name
Owned For
Owner Type
Purchase Details
Closed on
Feb 27, 2017
Sold by
Robert H Dickerson
Bought by
Fowler Christopher
Current Estimated Value
Home Financials for this Owner
Home Financials are based on the most recent Mortgage that was taken out on this home.
Original Mortgage
$184,476
Outstanding Balance
$152,935
Interest Rate
4.16%
Estimated Equity
$215,677
Purchase Details
Closed on
Jul 31, 2008
Sold by
Fowler C Brad
Bought by
Fowler C Brad and Fowler Kathleen W
Home Financials for this Owner
Home Financials are based on the most recent Mortgage that was taken out on this home.
Original Mortgage
$191,000
Interest Rate
6.43%
Mortgage Type
Stand Alone Refi Refinance Of Original Loan
Purchase Details
Closed on
Jun 23, 2003
Sold by
Kitchens Howard T and Kitchens Karen*
Bought by
Fowler C Brad
Purchase Details
Closed on
Jun 24, 1999
Sold by
Morris Richard G and Morris Bonnie
Bought by
Kitchens Howard T and Kitchens Karen*
Purchase Details
Closed on
Feb 26, 1993
Bought by
Morris Richard G and Morris Bonnie
Create a Home Valuation Report for This Property
The Home Valuation Report is an in-depth analysis detailing your home's value as well as a comparison with similar homes in the area
Home Values in the Area
Average Home Value in this Area
Purchase History
| Date | Buyer | Sale Price | Title Company |
|---|---|---|---|
| Fowler Christopher | -- | -- | |
| Fowler C Brad | -- | None Available | |
| Fowler C Brad | $46,000 | -- | |
| Kitchens Howard T | $36,000 | -- | |
| Morris Richard G | $30,000 | -- |
Source: Public Records
Mortgage History
| Date | Status | Borrower | Loan Amount |
|---|---|---|---|
| Open | Fowler Christopher | $184,476 | |
| Closed | Fowler Christopher | -- | |
| Previous Owner | Fowler C Brad | $191,000 |
Source: Public Records
Tax History Compared to Growth
Tax History
| Year | Tax Paid | Tax Assessment Tax Assessment Total Assessment is a certain percentage of the fair market value that is determined by local assessors to be the total taxable value of land and additions on the property. | Land | Improvement |
|---|---|---|---|---|
| 2024 | $3,206 | $136,040 | $46,000 | $90,040 |
| 2023 | $2,774 | $116,760 | $42,000 | $74,760 |
| 2022 | $2,676 | $112,720 | $42,000 | $70,720 |
| 2021 | $2,636 | $110,480 | $40,000 | $70,480 |
| 2020 | $2,228 | $93,280 | $23,000 | $70,280 |
| 2019 | $2,228 | $93,280 | $23,000 | $70,280 |
| 2018 | $2,228 | $93,280 | $23,000 | $70,280 |
| 2017 | $2,230 | $93,280 | $23,000 | $70,280 |
| 2016 | $2,234 | $93,280 | $23,000 | $70,280 |
| 2015 | $2,238 | $93,280 | $23,000 | $70,280 |
| 2014 | -- | $93,680 | $23,000 | $70,680 |
| 2013 | -- | $93,680 | $23,000 | $70,680 |
Source: Public Records
Map
Nearby Homes
- 106 Planter's Ridge Trail
- 238 Old Hollow Way
- 531 Bristleleaf Path
- 533 Bristleleaf Path
- 529 Bristleleaf Path
- 202 Emberwood Way
- 107 Black Birch Ln
- 101 Black Birch Ln
- 521 Bristleleaf Path
- 523 Bristleleaf Path
- 525 Bristleleaf Path
- 109 Black Birch Ln
- 000 Piney Grove Rd
- 105 Black Birch Ln
- 102 Black Birch Ln
- 315 Willowbrook Ln
- 119 Black Birch Ln
- 612 Willowbrook Ln
- 607 Willowbrook Ln
- 604 Willowbrook Ln
- 100 Leisure Ln
- 303 Sylvan Dr
- 300 Sylvan Dr
- 109 Leisure Ln
- 103 Leisure Ln
- 106 Leisure Ln
- 209 Sylvan Dr
- 302 Sylvan Dr
- 145 Sylvan Dr
- 140 Sylvan Dr
- 2847 Ga Highway 127
- 0 Sylvan Dr Unit 7454351
- 0 Sylvan Dr
- 141 Sylvan Dr
- 304A Sylvan Dr
- 136 Sylvan Dr
- 304 Sylvan Dr
- 137 Sylvan Dr
- 1044 Ga Highway 247 S
- 135 Sylvan Dr