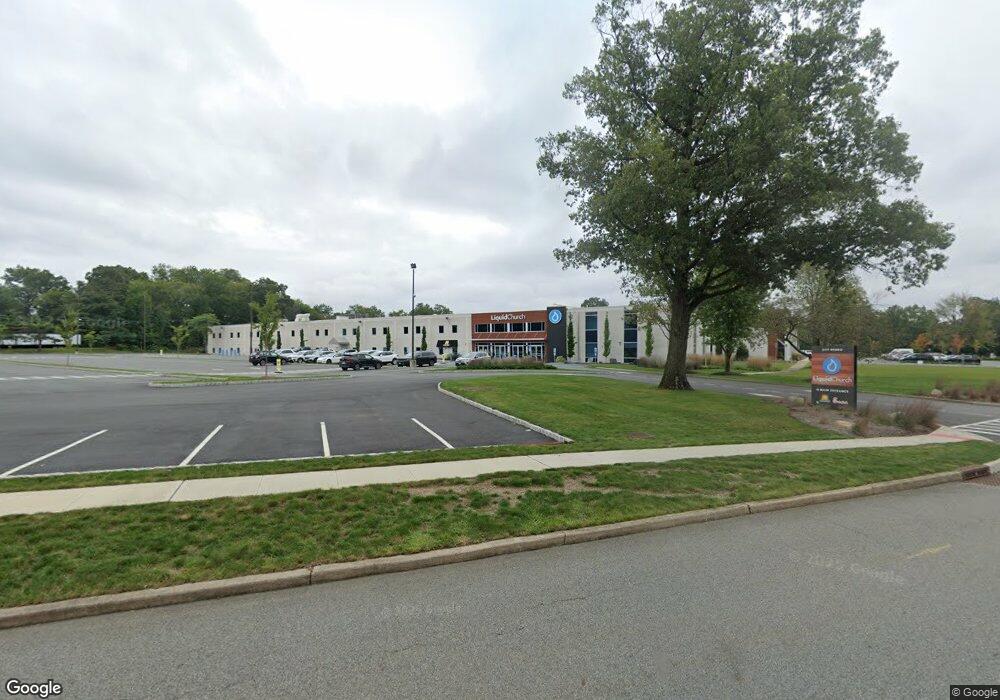
299 Webro Rd Parsippany, NJ 07054
Estimated Value: $19,307,268
--
Bed
--
Bath
163,474
Sq Ft
$118/Sq Ft
Est. Value
About This Home
This home is located at 299 Webro Rd, Parsippany, NJ 07054 and is currently priced at $19,307,268, approximately $118 per square foot. 299 Webro Rd is a home with nearby schools including Northvail Elementary School, Central Middle School, and Parsippany High School.
Ownership History
Date
Name
Owned For
Owner Type
Purchase Details
Closed on
Jan 5, 2018
Sold by
Campden Associates Llc
Bought by
Liquid Church
Current Estimated Value
Purchase Details
Closed on
Nov 21, 2000
Sold by
Nj Office Realty Holding Company
Bought by
Campden Associates Llc
Home Financials for this Owner
Home Financials are based on the most recent Mortgage that was taken out on this home.
Original Mortgage
$7,500,000
Interest Rate
7.78%
Mortgage Type
Commercial
Purchase Details
Closed on
Jun 30, 1999
Sold by
Msgw Real Estate Fund Llc
Bought by
Nj Office Realty Holding Company
Purchase Details
Closed on
Oct 15, 1996
Sold by
The Mutual Life Insurance Company Of Ny
Bought by
Msgw Real Estate Fund Llc
Create a Home Valuation Report for This Property
The Home Valuation Report is an in-depth analysis detailing your home's value as well as a comparison with similar homes in the area
Home Values in the Area
Average Home Value in this Area
Purchase History
| Date | Buyer | Sale Price | Title Company |
|---|---|---|---|
| Liquid Church | $14,288,500 | First American Title Ins Co | |
| Campden Associates Llc | $10,330,000 | -- | |
| Nj Office Realty Holding Company | $8,600,000 | -- | |
| Msgw Real Estate Fund Llc | -- | -- | |
| Msgw Real Estate Fund Llc | $4,325,000 | -- |
Source: Public Records
Mortgage History
| Date | Status | Borrower | Loan Amount |
|---|---|---|---|
| Previous Owner | Campden Associates Llc | $7,500,000 |
Source: Public Records
Tax History Compared to Growth
Tax History
| Year | Tax Paid | Tax Assessment Tax Assessment Total Assessment is a certain percentage of the fair market value that is determined by local assessors to be the total taxable value of land and additions on the property. | Land | Improvement |
|---|---|---|---|---|
| 2025 | -- | $8,065,300 | $4,140,000 | $3,925,300 |
| 2024 | -- | $8,065,300 | $4,140,000 | $3,925,300 |
| 2023 | -- | $8,065,300 | $4,140,000 | $3,925,300 |
| 2022 | -- | $8,065,300 | $4,140,000 | $3,925,300 |
| 2021 | $253,236 | $8,065,300 | $4,140,000 | $3,925,300 |
| 2020 | $217,791 | $8,065,300 | $4,140,000 | $3,925,300 |
| 2019 | $253,236 | $8,065,300 | $4,140,000 | $3,925,300 |
| 2018 | $206,276 | $8,693,300 | $4,768,000 | $3,925,300 |
| 2017 | $192,159 | $6,751,900 | $4,768,000 | $1,983,900 |
| 2016 | $188,716 | $6,751,900 | $4,768,000 | $1,983,900 |
| 2015 | $183,922 | $6,751,900 | $4,768,000 | $1,983,900 |
| 2014 | $181,424 | $6,751,900 | $4,768,000 | $1,983,900 |
Source: Public Records
Map
Nearby Homes
- 144 Jillian Blvd
- 91 Rhyan Dr
- 79 Rhyan Dr
- 44 Willow Ln
- 49 Willow Ln
- 51 Willow Ln
- Rockefeller with Library Plan at Parq
- Rockefeller Plan at Parq
- 14 Willow Ln
- 24 Leah Way
- 53 Westminster Dr
- 189 Littleton Rd Unit 41
- 209 Raymound Blvd
- 115 Northfield Rd
- 3 Queen St
- 72 Schindler Ct
- 32 Hardwick Ct
- 89 Schindler Ct
- 20 Sandra Dr
- 260 Everett Rd
- 339 Jefferson Rd
- 200 Webro Rd
- 1 Woodhollow Rd
- 234 Emily Place
- 228 Emily Place
- 222 Emily Place
- 210 Emily Place
- 240 Emily Place
- 206 Emily Place
- 246 Emily Place
- 252 Emily Place
- 258 Emily Place
- 198 Emily Place
- 192 Emily Place
- 264 Emily Place
- 186 Emily Place
- 270 Emily Place
- 180 Emily Place
- 174 Emily Place
- 276 Emily Place