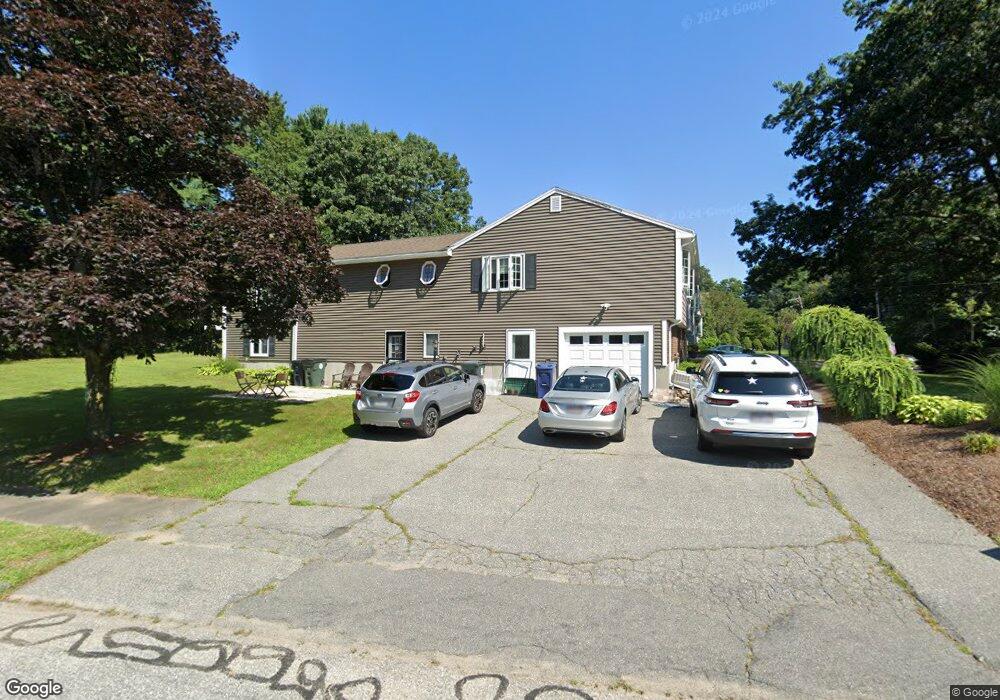
299 Woburn St Wilmington, MA 01887
North Wilmington NeighborhoodEstimated Value: $997,000 - $1,178,000
5
Beds
6
Baths
2,244
Sq Ft
$474/Sq Ft
Est. Value
About This Home
This home is located at 299 Woburn St, Wilmington, MA 01887 and is currently estimated at $1,062,811, approximately $473 per square foot. 299 Woburn St is a home located in Middlesex County with nearby schools including Wilmington Middle School, Wilmington High School, and Abundant Life Christian School and Childcare.
Ownership History
Date
Name
Owned For
Owner Type
Purchase Details
Closed on
Nov 8, 2024
Sold by
Agati Patricia A
Bought by
Agati Patricia A and Agati Kim M
Current Estimated Value
Purchase Details
Closed on
Dec 22, 2003
Sold by
Teixeira Oliverio M and Teixeira Maria J
Bought by
Agati Patricia A
Home Financials for this Owner
Home Financials are based on the most recent Mortgage that was taken out on this home.
Original Mortgage
$151,000
Interest Rate
5.96%
Mortgage Type
Purchase Money Mortgage
Create a Home Valuation Report for This Property
The Home Valuation Report is an in-depth analysis detailing your home's value as well as a comparison with similar homes in the area
Home Values in the Area
Average Home Value in this Area
Purchase History
| Date | Buyer | Sale Price | Title Company |
|---|---|---|---|
| Agati Patricia A | -- | None Available | |
| Agati Patricia A | -- | None Available | |
| Agati Patricia A | $2,000 | -- | |
| Agati Patricia A | $2,000 | -- |
Source: Public Records
Mortgage History
| Date | Status | Borrower | Loan Amount |
|---|---|---|---|
| Previous Owner | Agati Patricia A | $167,000 | |
| Previous Owner | Agati Patricia A | $30,000 | |
| Previous Owner | Agati Patricia A | $151,000 |
Source: Public Records
Tax History Compared to Growth
Tax History
| Year | Tax Paid | Tax Assessment Tax Assessment Total Assessment is a certain percentage of the fair market value that is determined by local assessors to be the total taxable value of land and additions on the property. | Land | Improvement |
|---|---|---|---|---|
| 2025 | $11,333 | $989,800 | $279,900 | $709,900 |
| 2024 | $11,148 | $975,300 | $279,900 | $695,400 |
| 2023 | $10,845 | $908,300 | $254,500 | $653,800 |
| 2022 | $9,214 | $707,100 | $212,000 | $495,100 |
| 2021 | $9,284 | $670,800 | $192,700 | $478,100 |
| 2020 | $9,813 | $722,600 | $192,700 | $529,900 |
| 2019 | $9,092 | $661,200 | $183,400 | $477,800 |
| 2018 | $8,511 | $590,600 | $174,800 | $415,800 |
| 2017 | $8,309 | $575,000 | $174,800 | $400,200 |
| 2016 | $7,834 | $535,500 | $166,500 | $369,000 |
| 2015 | $7,263 | $505,400 | $166,500 | $338,900 |
| 2014 | $6,825 | $479,300 | $158,700 | $320,600 |
Source: Public Records
Map
Nearby Homes
- 5 Flynn Way
- 42 High St
- 401 Middlesex Ave
- 9 Marie Dr
- 3 Powderhouse Cir
- 7 W Village Dr
- 11 Cedarcrest Rd
- 34 Glen Rd
- 39 West St
- 3 Catherine Ave
- 46 West St
- 62 Adams St
- 1 March Rd
- 36 Hanover St
- 260 Martins Landing Unit 103
- 240 Martins Landing Unit 409
- 240 Martins Landing Unit 201
- 260 Martins Landing Unit 508
- Lincoln Plan at Martins Landing
- Ivywood Plan at Martins Landing