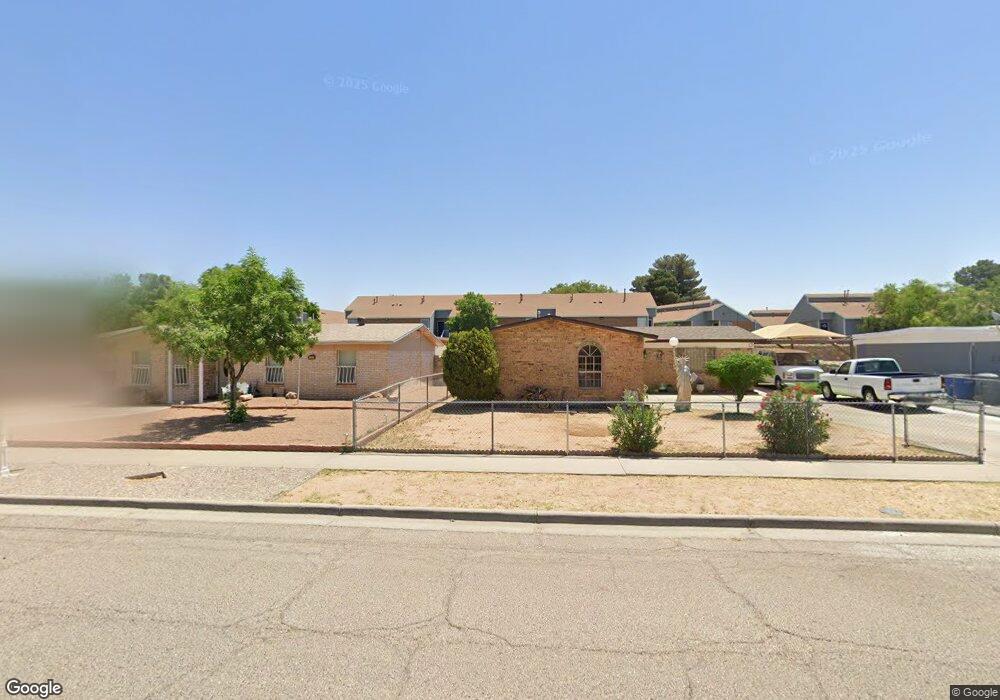
2990 Trawood Dr El Paso, TX 79936
Vista Del Sol Neighborhood
--
Bed
--
Bath
154,016
Sq Ft
8.05
Acres
About This Home
This home is located at 2990 Trawood Dr, El Paso, TX 79936. 2990 Trawood Dr is a home located in El Paso County with nearby schools including Tierra Del Sol Elementary School, J M Hanks High School, and EL PASO LEADERSHIP ACADEMY - MIDDLE EAST.
Ownership History
Date
Name
Owned For
Owner Type
Purchase Details
Closed on
Oct 27, 2016
Sold by
Wind Tree Hodlings Llc
Bought by
Post Wind Tree Llc
Home Financials for this Owner
Home Financials are based on the most recent Mortgage that was taken out on this home.
Original Mortgage
$7,262,000
Outstanding Balance
$5,844,791
Interest Rate
3.5%
Mortgage Type
New Conventional
Purchase Details
Closed on
Feb 26, 2007
Sold by
Wind Tree El Paso I Ltd
Bought by
Rre Wind Tree Holdings Llc
Home Financials for this Owner
Home Financials are based on the most recent Mortgage that was taken out on this home.
Original Mortgage
$5,800,000
Interest Rate
6.21%
Mortgage Type
Commercial
Purchase Details
Closed on
Oct 14, 2003
Sold by
Hueco Mountain Estates Inc
Bought by
Carpenter Robert H and Carpenter Patsy H
Home Financials for this Owner
Home Financials are based on the most recent Mortgage that was taken out on this home.
Original Mortgage
$20,152
Interest Rate
5.9%
Mortgage Type
Seller Take Back
Create a Home Valuation Report for This Property
The Home Valuation Report is an in-depth analysis detailing your home's value as well as a comparison with similar homes in the area
Home Values in the Area
Average Home Value in this Area
Purchase History
| Date | Buyer | Sale Price | Title Company |
|---|---|---|---|
| Post Wind Tree Llc | -- | Land Services Title Of Texas | |
| Rre Wind Tree Holdings Llc | -- | First American Title | |
| Carpenter Robert H | -- | -- |
Source: Public Records
Mortgage History
| Date | Status | Borrower | Loan Amount |
|---|---|---|---|
| Open | Post Wind Tree Llc | $7,262,000 | |
| Previous Owner | Rre Wind Tree Holdings Llc | $5,800,000 | |
| Previous Owner | Carpenter Robert H | $20,152 |
Source: Public Records
Tax History Compared to Growth
Tax History
| Year | Tax Paid | Tax Assessment Tax Assessment Total Assessment is a certain percentage of the fair market value that is determined by local assessors to be the total taxable value of land and additions on the property. | Land | Improvement |
|---|---|---|---|---|
| 2025 | -- | $16,119,320 | $1,126,033 | $14,993,287 |
| 2024 | -- | $17,983,290 | $1,126,033 | $16,857,257 |
| 2023 | $369,909 | $12,709,770 | $1,126,033 | $11,583,737 |
| 2022 | $394,683 | $12,709,770 | $1,126,033 | $11,583,737 |
| 2021 | $316,156 | $9,726,369 | $1,126,033 | $8,600,336 |
| 2020 | $307,209 | $9,726,369 | $1,126,033 | $8,600,336 |
| 2018 | $265,755 | $8,545,977 | $1,126,033 | $7,419,944 |
| 2017 | $265,565 | $8,687,929 | $1,126,033 | $7,561,896 |
| 2016 | $261,226 | $8,545,977 | $1,126,033 | $7,419,944 |
| 2015 | $186,775 | $7,024,003 | $1,126,033 | $5,897,970 |
| 2014 | $186,775 | $6,527,664 | $1,126,033 | $5,401,631 |
Source: Public Records
Map
Nearby Homes
- 1804 Jerry Abbott St
- 1739 Jerry Abbott St
- 3655 George Dieter Dr
- 1700 Jerry Abbott St
- 2101 E Glen Dr
- 1703 Robert Wynn St
- 1935 Bay City Place
- 1913 Seagull Dr
- 1733 Karl Wyler Dr
- 11204 Bob Mitchell Dr
- 1868 Tom Bolt Dr
- 2029 Greenlee Dr
- 1607 Tommy Aaron Dr
- 1617 Tommy Aaron Dr
- 2078 Gus Moran St
- 11268 Enid Wilson Ln
- 11663 Clear Lake Way
- 11262 Enid Wilson Ln
- 2604 Anise Dr
- 11506 James Grant Dr
- 2990 Trawood Dr
- 1830 George Dieter Dr Unit 103
- 1814 Ron Cerrudo St
- 1812 Ron Cerrudo St
- 1810 Ron Cerrudo St
- 1816 Ron Cerrudo St
- 1808 Ron Cerrudo St
- 1818 Ron Cerrudo St
- 1806 Ron Cerrudo St
- 1820 Ron Cerrudo St
- 8585 Paul Moran Place
- 1804 Ron Cerrudo St
- 1822 Ron Cerrudo St
- 1822 Ron Cerrudo St Unit 1
- 1802 Ron Cerrudo St
- 1824 Ron Cerrudo St
- 1813 Ron Cerrudo St
- 1815 Ron Cerrudo St
- 1811 Ron Cerrudo St
- 1817 Ron Cerrudo St