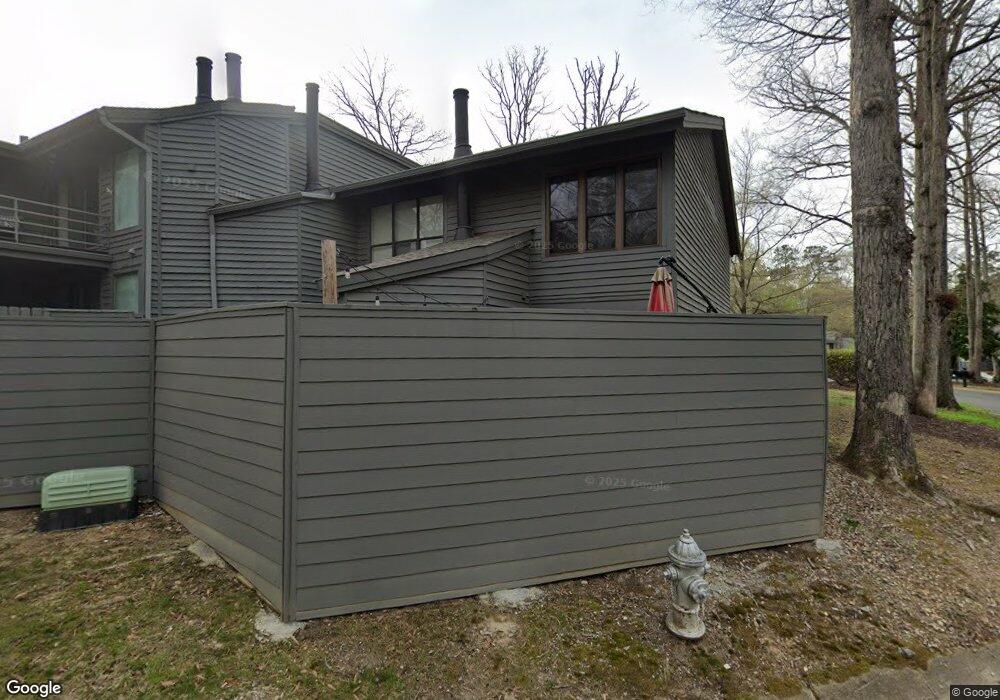
2990 Woodbridge Crossing Dr Unit End Midlothian, VA 23112
Estimated Value: $269,308 - $276,000
2
Beds
2
Baths
1,154
Sq Ft
$236/Sq Ft
Est. Value
About This Home
This home is located at 2990 Woodbridge Crossing Dr Unit End, Midlothian, VA 23112 and is currently estimated at $272,077, approximately $235 per square foot. 2990 Woodbridge Crossing Dr Unit End is a home located in Chesterfield County with nearby schools including Swift Creek Elementary School, Swift Creek Middle, and Clover Hill High.
Ownership History
Date
Name
Owned For
Owner Type
Purchase Details
Closed on
Jul 11, 2025
Sold by
Webb Christina L and Thomas Dean E
Bought by
Short Stacy M
Current Estimated Value
Home Financials for this Owner
Home Financials are based on the most recent Mortgage that was taken out on this home.
Original Mortgage
$261,250
Outstanding Balance
$260,808
Interest Rate
6.85%
Mortgage Type
New Conventional
Estimated Equity
$11,269
Purchase Details
Closed on
Aug 11, 2020
Sold by
Glaze Courtney C
Bought by
Thomas Dean E and Webb Christina L
Home Financials for this Owner
Home Financials are based on the most recent Mortgage that was taken out on this home.
Original Mortgage
$136,800
Interest Rate
2.9%
Mortgage Type
New Conventional
Purchase Details
Closed on
Jun 22, 2006
Sold by
Drumheller Melinda
Bought by
Nolan Elizabeth and Crawford,Courtney
Home Financials for this Owner
Home Financials are based on the most recent Mortgage that was taken out on this home.
Original Mortgage
$158,500
Interest Rate
6.59%
Mortgage Type
New Conventional
Purchase Details
Closed on
Dec 31, 2003
Sold by
Cleal Dorothy
Bought by
Nolan Melinda
Home Financials for this Owner
Home Financials are based on the most recent Mortgage that was taken out on this home.
Original Mortgage
$97,701
Interest Rate
5.86%
Mortgage Type
FHA
Create a Home Valuation Report for This Property
The Home Valuation Report is an in-depth analysis detailing your home's value as well as a comparison with similar homes in the area
Home Values in the Area
Average Home Value in this Area
Purchase History
| Date | Buyer | Sale Price | Title Company |
|---|---|---|---|
| Short Stacy M | $275,000 | Old Republic National Title In | |
| Short Stacy M | $275,000 | Old Republic National Title In | |
| Thomas Dean E | $152,000 | Attorney | |
| Nolan Elizabeth | $158,500 | -- | |
| Nolan Melinda | $99,950 | -- |
Source: Public Records
Mortgage History
| Date | Status | Borrower | Loan Amount |
|---|---|---|---|
| Open | Short Stacy M | $261,250 | |
| Closed | Short Stacy M | $261,250 | |
| Previous Owner | Thomas Dean E | $136,800 | |
| Previous Owner | Nolan Elizabeth | $158,500 | |
| Previous Owner | Nolan Melinda | $97,701 |
Source: Public Records
Tax History Compared to Growth
Tax History
| Year | Tax Paid | Tax Assessment Tax Assessment Total Assessment is a certain percentage of the fair market value that is determined by local assessors to be the total taxable value of land and additions on the property. | Land | Improvement |
|---|---|---|---|---|
| 2025 | $1,868 | $209,000 | $45,000 | $164,000 |
| 2024 | $1,868 | $202,600 | $45,000 | $157,600 |
| 2023 | $1,748 | $192,100 | $39,000 | $153,100 |
| 2022 | $1,495 | $162,500 | $37,000 | $125,500 |
| 2021 | $1,359 | $142,300 | $35,000 | $107,300 |
| 2020 | $1,326 | $139,600 | $35,000 | $104,600 |
| 2019 | $1,231 | $129,600 | $33,000 | $96,600 |
| 2018 | $1,223 | $127,300 | $33,000 | $94,300 |
| 2017 | $1,230 | $127,300 | $33,000 | $94,300 |
| 2016 | $1,154 | $120,200 | $33,000 | $87,200 |
| 2015 | $1,113 | $115,900 | $33,000 | $82,900 |
| 2014 | $1,058 | $110,200 | $33,000 | $77,200 |
Source: Public Records
Map
Nearby Homes
- 2980 Woodbridge Crossing Dr
- 13712 Woodbridge Crossing Way
- 3006 Three Bridges Rd
- 2800 Fox Chase Ln
- 13830 Crosstimbers Rd
- 2411 Arrowood Rd
- 13931 Sagegrove Cir
- 3114 Fox Chase Dr
- 3200 Hunts Bridge Ct
- 13809 Garrison Place Dr
- 3208 Quail Hill Dr
- 2604 Whispering Oaks Terrace
- 3207 Quail Hill Dr
- 3319 Seven Oaks Terrace
- 2303 Shadow Ridge Place
- 3301 Old Hundred Rd S
- 3209 Shadow Oaks Rd
- 3401 Quail Hill Dr
- 2201 Turtle Hill Ln
- 2206 Turtle Hill Ln
- 2988 Woodbridge Crossing Dr
- 2988 Woodbridge Crossing Dr
- 2988 Woodbridge Crossing Dr Unit 2988
- 2986 Woodbridge Crossing Dr
- 2984 Woodbridge Crossing Dr
- 2982 Woodbridge Crossing Dr
- 2982 Woodbridge Crossing Dr Unit 5-D-6
- 2982 Woodbridge Crossing Dr Unit 2982
- 2978 Woodbridge Crossing Dr
- 2976 Woodbridge Crossing Dr
- 2976 Woodbridge Crossing Dr Unit 2976
- 2976 Woodbridge Crossing Dr Unit N/A
- 2970 Woodbridge Crossing Dr
- 2970 Woodbridge Crossing Dr
- 2970 Woodbridge Crossing Dr Unit end unit
- 2970 Woodbridge Crossing Dr Unit 2709
- 2968 Woodbridge Crossing Dr
- 2974 Woodbridge Crossing Dr
- 2966 Woodbridge Crossing Dr