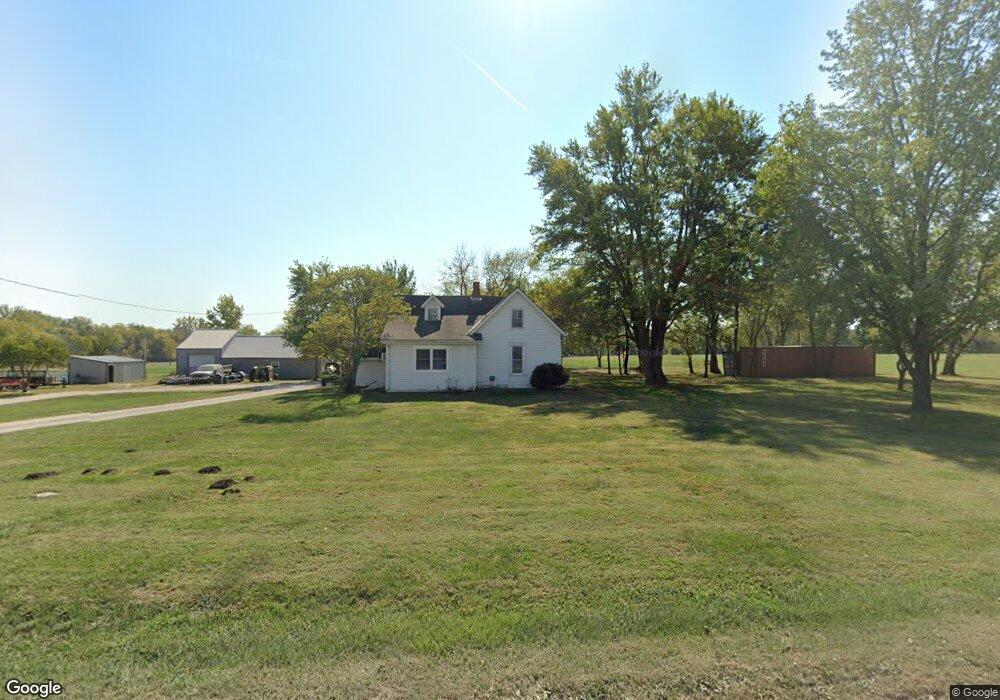
29901 E 219th St Pleasant Hill, MO 64080
Estimated Value: $273,813 - $869,000
2
Beds
1
Bath
1,786
Sq Ft
$294/Sq Ft
Est. Value
About This Home
This home is located at 29901 E 219th St, Pleasant Hill, MO 64080 and is currently estimated at $525,604, approximately $294 per square foot. 29901 E 219th St is a home located in Cass County with nearby schools including East Lynne Elementary School.
Ownership History
Date
Name
Owned For
Owner Type
Purchase Details
Closed on
Jun 7, 2023
Sold by
Schmoll Ernest Charles and Schmoll Candy
Bought by
Cornell Logan and Cornell Shelli L
Current Estimated Value
Purchase Details
Closed on
Mar 18, 2023
Sold by
Cornell Shell L and Cornell Logan
Bought by
Schmoll Ernest C and Schmoll Candy
Purchase Details
Closed on
Mar 17, 2023
Sold by
Sparks Deborah L and Sparks John
Bought by
Schmoll Ernest C and Schmoll Candy
Purchase Details
Closed on
Aug 26, 2021
Sold by
Althea Schrnoll Edna
Bought by
Roach Dandle R
Purchase Details
Closed on
Aug 25, 2021
Sold by
Kirk Joyce A
Bought by
Schmollp Ernest Charles and Schmoll Candy
Purchase Details
Closed on
Apr 12, 2021
Sold by
Epps Bonnie Kay
Bought by
Estate Of Joyce A Kirk
Create a Home Valuation Report for This Property
The Home Valuation Report is an in-depth analysis detailing your home's value as well as a comparison with similar homes in the area
Home Values in the Area
Average Home Value in this Area
Purchase History
| Date | Buyer | Sale Price | Title Company |
|---|---|---|---|
| Cornell Logan | -- | None Listed On Document | |
| Schmoll Ernest C | -- | -- | |
| Schmoll Ernest C | -- | -- | |
| Schmoll Ernest C | -- | -- | |
| Schmoll Ernest C | -- | -- | |
| Cornell Shelli L | -- | -- | |
| Roach Dandle R | -- | -- | |
| Schmollp Ernest Charles | $156,000 | None Listed On Document | |
| Epps Bonnie Kay | -- | None Listed On Document | |
| Epps Bonnie Kay | -- | None Available | |
| Estate Of Joyce A Kirk | -- | None Available | |
| Schmoll Ernest C | -- | None Listed On Document | |
| Estate Of Joyce A Kirk | -- | None Available | |
| Estate Of Ernest C Schmoll Jr | -- | None Available |
Source: Public Records
Tax History Compared to Growth
Tax History
| Year | Tax Paid | Tax Assessment Tax Assessment Total Assessment is a certain percentage of the fair market value that is determined by local assessors to be the total taxable value of land and additions on the property. | Land | Improvement |
|---|---|---|---|---|
| 2024 | $819 | $13,390 | $1,770 | $11,620 |
| 2023 | $819 | $13,390 | $1,770 | $11,620 |
| 2022 | $776 | $12,270 | $1,770 | $10,500 |
| 2021 | $735 | $12,270 | $1,770 | $10,500 |
| 2020 | $975 | $16,690 | $7,030 | $9,660 |
| 2019 | $955 | $16,690 | $7,030 | $9,660 |
| 2018 | $929 | $15,370 | $6,440 | $8,930 |
| 2017 | $898 | $15,370 | $6,440 | $8,930 |
| 2016 | $898 | $14,920 | $6,440 | $8,480 |
| 2015 | $912 | $14,920 | $6,440 | $8,480 |
| 2014 | $796 | $14,300 | $6,240 | $8,060 |
| 2013 | -- | $14,300 | $6,240 | $8,060 |
Source: Public Records
Map
Nearby Homes
- 30909 E 219th St
- 23020 S Valley Rd
- TBD S Pryor Rd
- 0000 S Pryor Rd
- 23510 S Airport Rd
- Tbd South Pryor Rd
- 23000 S Camp Branch Rd
- 0000 E State Route P
- Lot 4 State Rt K Hwy
- Lot 3 State Rt K Hwy
- Lot 2 State Rt K Hwy
- 23700 S State Rt K Hwy
- 28605 E 239th St
- East State Route Ee N A
- 27101 E State Route Ee
- 0 E 235th St
- 0 E 235th St
- 22920 S Staley Mound Rd
- 20909 & 20911 S Staley Mound Rd
- 0 State Rt Ee Rd
- 22008 S Valley Rd
- 22101 S Valley Rd
- 30101 E 222nd Ct
- 30108 E 222nd Ct
- 22221 S Valley Rd
- 30005 E 219th St
- 22009 S Valley Rd
- 30109 E 219th St
- 30107 E 222nd Ct
- 30109 E 222nd Ct
- 30000 E 219th St
- 30110 E 222nd Ct
- 22320 S Valley Rd
- 30211 E 219th St
- 30311 E 219th St
- 0 E 219th St Unit 1699226
- 0 E 219th St Unit 1718967
- 0 E 219 St Unit 1753412
- NONE E 219th St
- 0 E 219th St Unit 2427910