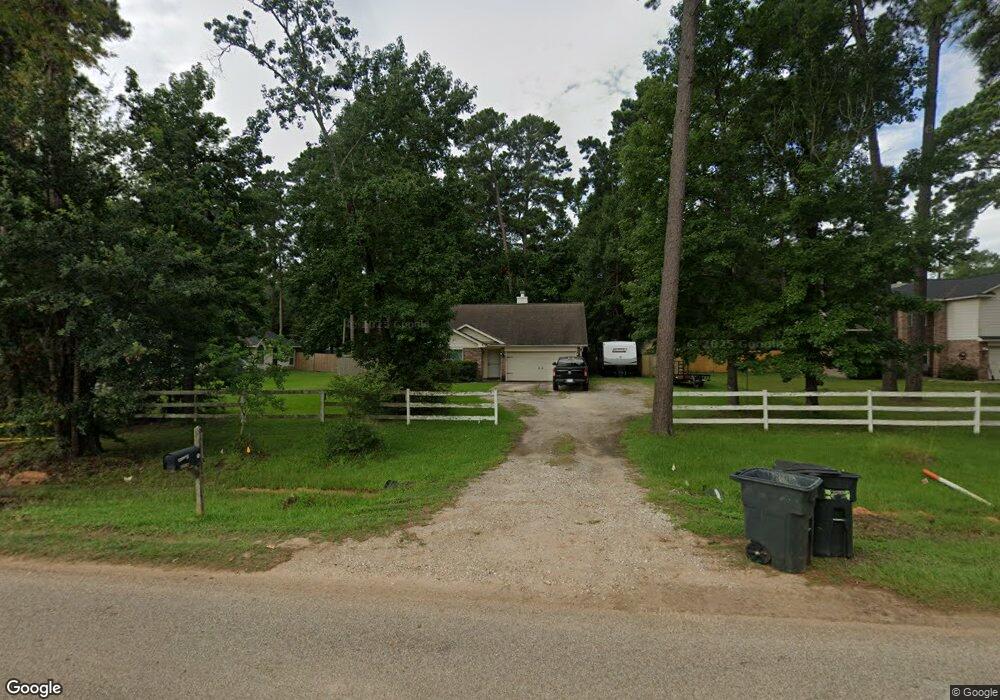
29903 Dobbin Hufsmith Rd Magnolia, TX 77354
Estimated Value: $250,894 - $529,000
--
Bed
--
Bath
1,542
Sq Ft
$219/Sq Ft
Est. Value
About This Home
This home is located at 29903 Dobbin Hufsmith Rd, Magnolia, TX 77354 and is currently estimated at $337,224, approximately $218 per square foot. 29903 Dobbin Hufsmith Rd is a home located in Montgomery County with nearby schools including Magnolia Parkway Elementary School, Bear Branch Junior High School, and Magnolia High School.
Ownership History
Date
Name
Owned For
Owner Type
Purchase Details
Closed on
Jun 19, 2009
Sold by
Brown Stefanie S and Brown Michael B
Bought by
Pace William M and Pace Leah M
Current Estimated Value
Home Financials for this Owner
Home Financials are based on the most recent Mortgage that was taken out on this home.
Original Mortgage
$153,664
Outstanding Balance
$97,453
Interest Rate
4.84%
Mortgage Type
FHA
Estimated Equity
$239,771
Purchase Details
Closed on
Aug 3, 2005
Sold by
Scenic Classic Homes Inc
Bought by
Wiese Stacy Lee and Wiese Ginger Racquel
Home Financials for this Owner
Home Financials are based on the most recent Mortgage that was taken out on this home.
Original Mortgage
$102,870
Interest Rate
5.55%
Mortgage Type
FHA
Purchase Details
Closed on
Aug 29, 2002
Sold by
Dark William E
Bought by
Wiese Stacy Lee and Ginger Racquel
Create a Home Valuation Report for This Property
The Home Valuation Report is an in-depth analysis detailing your home's value as well as a comparison with similar homes in the area
Home Values in the Area
Average Home Value in this Area
Purchase History
| Date | Buyer | Sale Price | Title Company |
|---|---|---|---|
| Pace William M | -- | Stewart Title Of Montgomery | |
| Wiese Stacy Lee | -- | Alamo Title Company | |
| Wiese Stacy Lee | -- | -- |
Source: Public Records
Mortgage History
| Date | Status | Borrower | Loan Amount |
|---|---|---|---|
| Open | Pace William M | $153,664 | |
| Previous Owner | Wiese Stacy Lee | $102,870 |
Source: Public Records
Tax History Compared to Growth
Tax History
| Year | Tax Paid | Tax Assessment Tax Assessment Total Assessment is a certain percentage of the fair market value that is determined by local assessors to be the total taxable value of land and additions on the property. | Land | Improvement |
|---|---|---|---|---|
| 2025 | $2,873 | $269,133 | $33,750 | $235,383 |
| 2024 | $2,574 | $257,448 | $33,750 | $223,698 |
| 2023 | $2,574 | $238,030 | $33,760 | $230,140 |
| 2022 | $3,818 | $216,390 | $27,000 | $225,270 |
| 2021 | $3,656 | $196,720 | $27,000 | $184,640 |
| 2020 | $3,619 | $178,840 | $27,000 | $151,840 |
| 2019 | $3,485 | $173,070 | $27,000 | $153,440 |
| 2018 | $2,810 | $157,340 | $7,490 | $170,600 |
| 2017 | $3,033 | $143,040 | $7,490 | $154,460 |
| 2016 | $2,758 | $130,040 | $7,490 | $154,460 |
| 2015 | $2,091 | $118,220 | $7,490 | $142,240 |
| 2014 | $2,091 | $107,470 | $7,490 | $99,980 |
Source: Public Records
Map
Nearby Homes
- 29907 Brownsville St
- 30305 Ruby Forest Ct
- 30309 Ruby Forest Ct
- 30314 Ruby Forest Ct
- 30401 Creek Valley Ct
- 30313 Ruby Forest Ct
- 30318 Ruby Forest Ct
- 30410 Creek Valley Ct
- 30322 Ruby Forest Ct
- 30414 Creek Valley Ct
- 29946 Stony Forest Dr
- 29942 Stony Forest Dr
- 29938 Stony Forest Dr
- 29973 Stony Forest Dr
- 29985 Stony Forest Dr
- 29981 Stony Forest Dr
- 29977 Stony Forest Dr
- 29965 Stony Forest Dr
- 29969 Stony Forest Dr
- 29957 Stony Forest Dr
- 29903 Dobbin-Huffsmith Rd
- 29819 Dobbin-Huffsmith Rd
- 29907 Dobbin-Huffsmith Rd
- 29907 Dobbin Hufsmith Rd
- 29819 Dobbin Huffsmith Rd
- 29902 Amarillo St
- 29906 Amarillo St
- 29814 Amarillo St
- 29814 Amarillo St
- 29911 Dobbin Hufsmith Rd
- 29815 Dobbin Hufsmith Rd
- 29910 Amarillo St
- 29811 Dobbin Hufsmith Rd
- 29811 Dobbin-Huffsmith Rd
- 29906 Dobbin Huffsmith Rd
- 29906 Dobbin-Huffsmith Rd
- 29903 Amarillo St
- 29914 Amarillo St
- 29810 Amarillo St
- 29819 Amarillo St