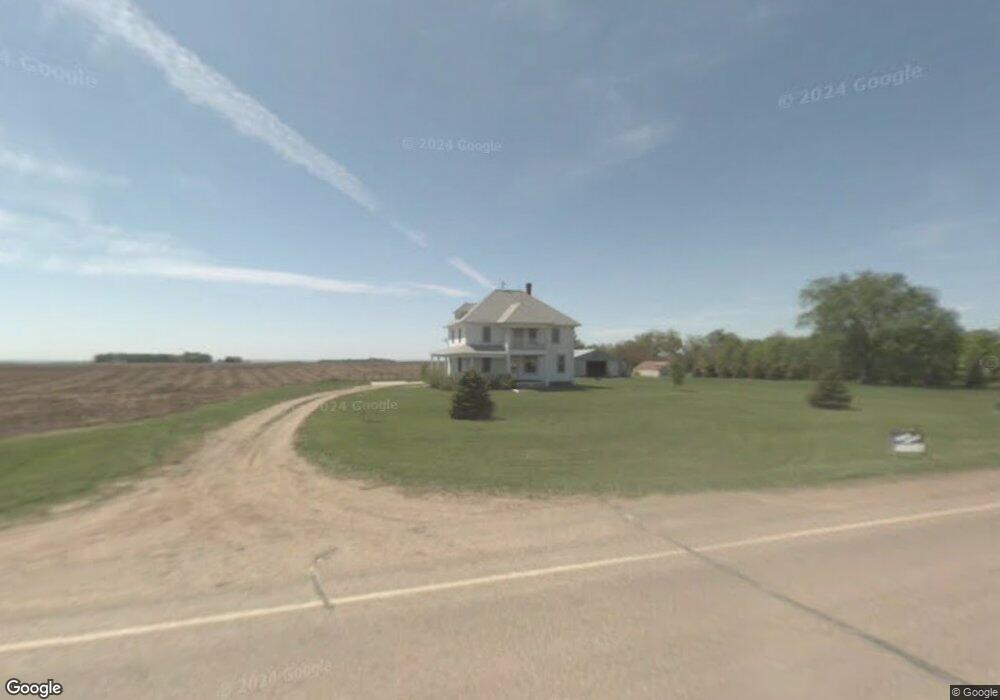
29911 471st Ave Beresford, SD 57004
Estimated Value: $295,704 - $420,000
4
Beds
2
Baths
2,289
Sq Ft
$160/Sq Ft
Est. Value
About This Home
This home is located at 29911 471st Ave, Beresford, SD 57004 and is currently estimated at $366,926, approximately $160 per square foot. 29911 471st Ave is a home located in Union County with nearby schools including Beresford Elementary School, Beresford Middle School, and Beresford High School.
Ownership History
Date
Name
Owned For
Owner Type
Purchase Details
Closed on
May 27, 2010
Sold by
Pellum Alan R and Pellum Rebbecca S
Bought by
Harris Roy A and Harris Amber L
Current Estimated Value
Home Financials for this Owner
Home Financials are based on the most recent Mortgage that was taken out on this home.
Original Mortgage
$158,083
Outstanding Balance
$106,989
Interest Rate
5.25%
Mortgage Type
FHA
Estimated Equity
$259,937
Create a Home Valuation Report for This Property
The Home Valuation Report is an in-depth analysis detailing your home's value as well as a comparison with similar homes in the area
Home Values in the Area
Average Home Value in this Area
Purchase History
| Date | Buyer | Sale Price | Title Company |
|---|---|---|---|
| Harris Roy A | $161,000 | None Available |
Source: Public Records
Mortgage History
| Date | Status | Borrower | Loan Amount |
|---|---|---|---|
| Open | Harris Roy A | $158,083 |
Source: Public Records
Tax History Compared to Growth
Tax History
| Year | Tax Paid | Tax Assessment Tax Assessment Total Assessment is a certain percentage of the fair market value that is determined by local assessors to be the total taxable value of land and additions on the property. | Land | Improvement |
|---|---|---|---|---|
| 2025 | $2,518 | $215,760 | $37,383 | $178,377 |
| 2024 | $2,518 | $215,760 | $37,383 | $178,377 |
| 2023 | $2,652 | $238,859 | $26,703 | $212,156 |
| 2022 | $2,682 | $192,270 | $19,072 | $173,198 |
| 2021 | $2,622 | $192,270 | $19,072 | $173,198 |
| 2020 | $2,574 | $184,849 | $19,072 | $165,777 |
| 2019 | $2,471 | $36,437 | $19,072 | $17,365 |
| 2018 | $2,471 | $36,437 | $19,072 | $17,365 |
| 2017 | $2,242 | $184,849 | $0 | $184,849 |
| 2016 | $2,348 | $163,003 | $0 | $163,003 |
| 2015 | $2,348 | $163,003 | $0 | $163,003 |
| 2014 | $2,270 | $160,239 | $0 | $160,239 |
| 2013 | $1,914 | $160,239 | $0 | $160,239 |
| 2012 | $1,914 | $138,618 | $13,820 | $124,798 |
Source: Public Records
Map
Nearby Homes