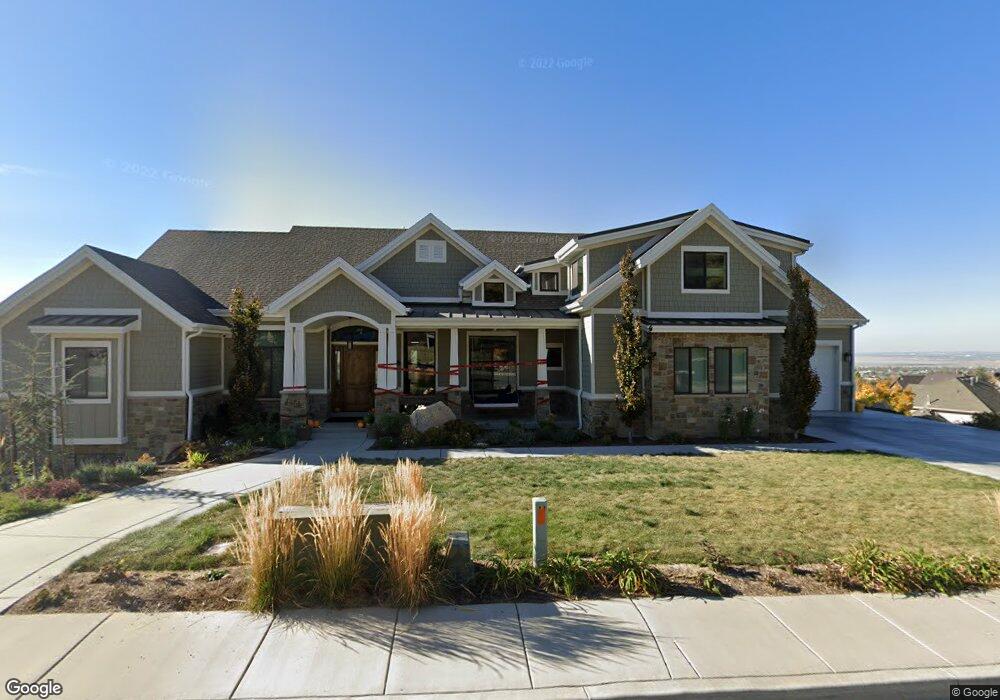
2992 S 400 E Bountiful, UT 84010
Estimated Value: $1,529,000 - $1,871,069
7
Beds
5
Baths
3,749
Sq Ft
$442/Sq Ft
Est. Value
About This Home
This home is located at 2992 S 400 E, Bountiful, UT 84010 and is currently estimated at $1,656,690, approximately $441 per square foot. 2992 S 400 E is a home with nearby schools including Muir School, Mueller Park Junior High School, and Woods Cross High School.
Ownership History
Date
Name
Owned For
Owner Type
Purchase Details
Closed on
Sep 30, 2020
Sold by
Freebairn Stephen M and Freebairn Brooke P
Bought by
Freebairn Stephen M and Freebairn Brooke P
Current Estimated Value
Purchase Details
Closed on
Jul 13, 2018
Sold by
Freebairn Stephen M and Freebairn Brooke P
Bought by
Freebairn Stephen M and Freebairn Brooke P
Home Financials for this Owner
Home Financials are based on the most recent Mortgage that was taken out on this home.
Original Mortgage
$453,100
Interest Rate
4.5%
Mortgage Type
New Conventional
Purchase Details
Closed on
Apr 13, 2012
Sold by
Foss Lewis Associates Lc
Bought by
Freebairn Stephen M and Freebairn Brooke P
Home Financials for this Owner
Home Financials are based on the most recent Mortgage that was taken out on this home.
Original Mortgage
$152,000
Interest Rate
3.86%
Mortgage Type
Purchase Money Mortgage
Create a Home Valuation Report for This Property
The Home Valuation Report is an in-depth analysis detailing your home's value as well as a comparison with similar homes in the area
Purchase History
| Date | Buyer | Sale Price | Title Company |
|---|---|---|---|
| Freebairn Stephen M | -- | None Available | |
| Freebairn Stephen M | -- | North American Title | |
| Freebairn Stephen M | -- | Aspen Title Insuranc |
Source: Public Records
Mortgage History
| Date | Status | Borrower | Loan Amount |
|---|---|---|---|
| Previous Owner | Freebairn Stephen M | $453,100 | |
| Previous Owner | Freebairn Stephen M | $152,000 |
Source: Public Records
Tax History
| Year | Tax Paid | Tax Assessment Tax Assessment Total Assessment is a certain percentage of the fair market value that is determined by local assessors to be the total taxable value of land and additions on the property. | Land | Improvement |
|---|---|---|---|---|
| 2025 | $9,977 | $914,100 | $195,325 | $718,775 |
| 2024 | $9,497 | $897,050 | $178,242 | $718,808 |
| 2023 | $8,988 | $1,539,000 | $348,179 | $1,190,821 |
| 2022 | $8,529 | $797,500 | $189,049 | $608,451 |
| 2021 | $0 | $1,130,000 | $283,245 | $846,755 |
| 2020 | $7,101 | $1,026,000 | $257,320 | $768,680 |
| 2019 | $7,075 | $998,000 | $200,702 | $797,298 |
| 2018 | $3,920 | $516,372 | $192,918 | $323,454 |
| 2016 | $2,817 | $195,459 | $195,459 | $0 |
| 2015 | $2,956 | $195,459 | $195,459 | $0 |
| 2014 | $2,863 | $195,459 | $195,459 | $0 |
| 2013 | -- | $172,511 | $172,511 | $0 |
Source: Public Records
Map
Nearby Homes
- 438 Indian Springs Rd
- 424 E Canyon Estates Dr S
- 610 Meadowlark Ln
- 3551 S Huntington Dr
- 69 E North Canyon Rd
- 11 E Bonneville Dr
- 2292 S 250 E
- 3727 S 400 E
- 8 E 3500 S
- 3716 S Oakridge Cir
- 19 E North Canyon Rd
- 2273 S 200 E
- 993 Canyon Creek Dr
- 110 2250 S
- 761 San Simeon Way
- 320 E 2100 S
- 831 E San Simeon Way S
- 2053 S 350 E Unit 7
- 2046 S 350 E Unit 4
- 296 E 2050 S Unit 2
- 2960 Foss Cir
- 331 Lewis Park Cove
- 2933 Foss Cir
- 2956 Foss Cir
- 2993 S 400 E
- 2983 S 400 E
- 2956 S 400 E
- 2963 S 400 E
- 2911 Foss Cir
- 2943 S 400 E
- 2942 Foss Cir
- 2909 Foss Cir
- 302 Lewis Park Cove
- 281 Lewis Park Cove Unit 611
- 3045 S 400 E
- 309 E 3050 S
- 2896 S 400 E
- 2922 Foss Cir
- 2891 Foss Cir
- 340 E North Canyon Rd
Your Personal Tour Guide
Ask me questions while you tour the home.