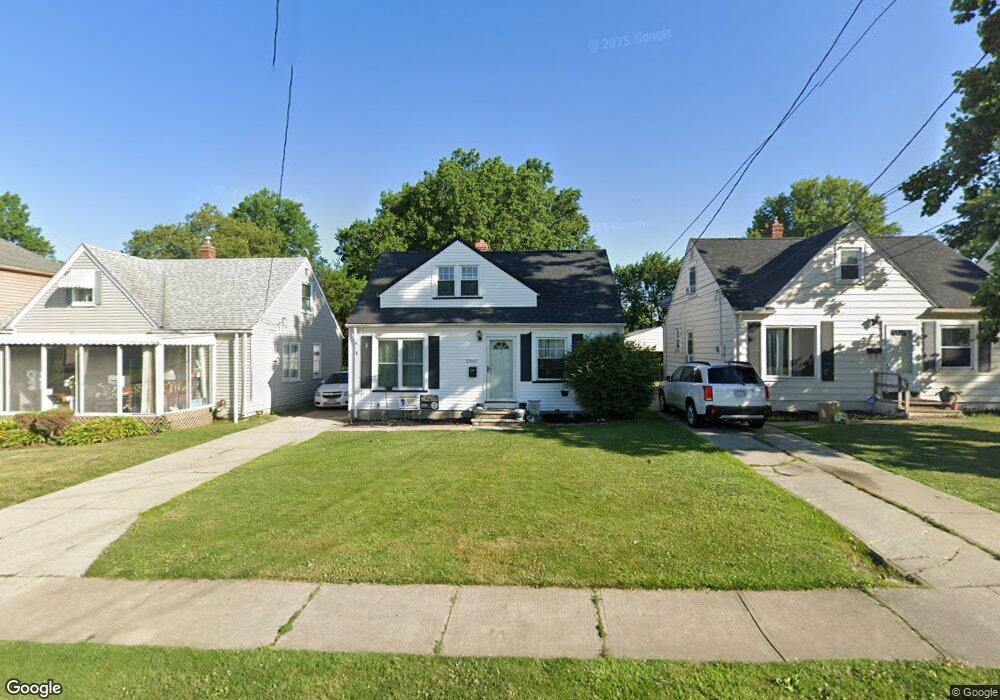
29923 Phillips Ave Wickliffe, OH 44092
Estimated Value: $166,092 - $189,000
3
Beds
1
Bath
754
Sq Ft
$237/Sq Ft
Est. Value
About This Home
This home is located at 29923 Phillips Ave, Wickliffe, OH 44092 and is currently estimated at $178,523, approximately $236 per square foot. 29923 Phillips Ave is a home located in Lake County with nearby schools including Wickliffe Elementary School, Wickliffe Middle School, and Wickliffe High School.
Ownership History
Date
Name
Owned For
Owner Type
Purchase Details
Closed on
Nov 10, 2005
Sold by
Behrens William C
Bought by
Champa Andrew
Current Estimated Value
Home Financials for this Owner
Home Financials are based on the most recent Mortgage that was taken out on this home.
Original Mortgage
$109,000
Outstanding Balance
$58,432
Interest Rate
5.98%
Mortgage Type
Fannie Mae Freddie Mac
Estimated Equity
$120,091
Purchase Details
Closed on
Oct 20, 2003
Sold by
Peterlin Robert A and Peterlin Kelly M
Bought by
Behrens William C
Home Financials for this Owner
Home Financials are based on the most recent Mortgage that was taken out on this home.
Original Mortgage
$106,000
Interest Rate
6.04%
Mortgage Type
Purchase Money Mortgage
Purchase Details
Closed on
Apr 8, 2003
Sold by
Penkowski James D and Penkowski Michelle R
Bought by
Peterlin Robert A
Home Financials for this Owner
Home Financials are based on the most recent Mortgage that was taken out on this home.
Original Mortgage
$67,500
Interest Rate
5.87%
Purchase Details
Closed on
Mar 30, 1994
Bought by
Penkowski James D
Create a Home Valuation Report for This Property
The Home Valuation Report is an in-depth analysis detailing your home's value as well as a comparison with similar homes in the area
Home Values in the Area
Average Home Value in this Area
Purchase History
| Date | Buyer | Sale Price | Title Company |
|---|---|---|---|
| Champa Andrew | $109,000 | -- | |
| Behrens William C | $112,000 | -- | |
| Peterlin Robert A | $75,000 | Progressive Land Title | |
| Penkowski James D | $69,900 | -- |
Source: Public Records
Mortgage History
| Date | Status | Borrower | Loan Amount |
|---|---|---|---|
| Open | Champa Andrew | $109,000 | |
| Previous Owner | Behrens William C | $106,000 | |
| Previous Owner | Peterlin Robert A | $67,500 |
Source: Public Records
Tax History
| Year | Tax Paid | Tax Assessment Tax Assessment Total Assessment is a certain percentage of the fair market value that is determined by local assessors to be the total taxable value of land and additions on the property. | Land | Improvement |
|---|---|---|---|---|
| 2025 | -- | $54,260 | $9,980 | $44,280 |
| 2024 | -- | $54,260 | $9,980 | $44,280 |
| 2023 | $4,100 | $33,340 | $8,510 | $24,830 |
| 2022 | $2,392 | $33,340 | $8,510 | $24,830 |
| 2021 | $2,643 | $33,340 | $8,510 | $24,830 |
| 2020 | $2,317 | $27,330 | $6,970 | $20,360 |
| 2019 | $2,498 | $27,330 | $6,970 | $20,360 |
| 2018 | $2,190 | $32,780 | $10,890 | $21,890 |
| 2017 | $2,309 | $32,780 | $10,890 | $21,890 |
| 2016 | $2,298 | $32,780 | $10,890 | $21,890 |
| 2015 | $2,258 | $32,780 | $10,890 | $21,890 |
| 2014 | $1,989 | $32,780 | $10,890 | $21,890 |
| 2013 | $1,988 | $32,780 | $10,890 | $21,890 |
Source: Public Records
Map
Nearby Homes
- 29800 Robert St
- 30002 Barjode Rd
- 29103 Barjode Rd
- 30224 Regent Rd
- 30116 Barjode Rd
- 940 Talmadge Ave
- 30243 Truman Ave
- 29690 Franklin Ave
- 28759 Forest Rd
- 29070 W Willowick Dr
- 29616 Grand Blvd
- 866 Elmwood Ave
- 375 Beechwood Dr
- 30102 Mildred Dr
- 953 Bryn Mawr Ave
- 30408 Mildred Dr
- 311 E 293rd St
- 29902 Euclid Ave Unit B7
- 1544 Ridgewick Dr
- 30325 Mildred Dr
- 29919 Phillips Ave
- 29927 Phillips Ave
- 29915 Phillips Ave
- 29931 Phillips Ave
- 29924 Phillips Ave
- 947 Worden Rd
- 29920 Phillips Ave
- 29939 Phillips Ave
- 29928 Phillips Ave
- 953 Worden Rd
- 943 Worden Rd
- 29916 Phillips Ave
- 29932 Phillips Ave
- 29943 Phillips Ave
- 961 Worden Rd
- 935 Worden Rd
- 29936 Phillips Ave
- 29940 Phillips Ave
- 967 Worden Rd
- 29947 Phillips Ave
Your Personal Tour Guide
Ask me questions while you tour the home.