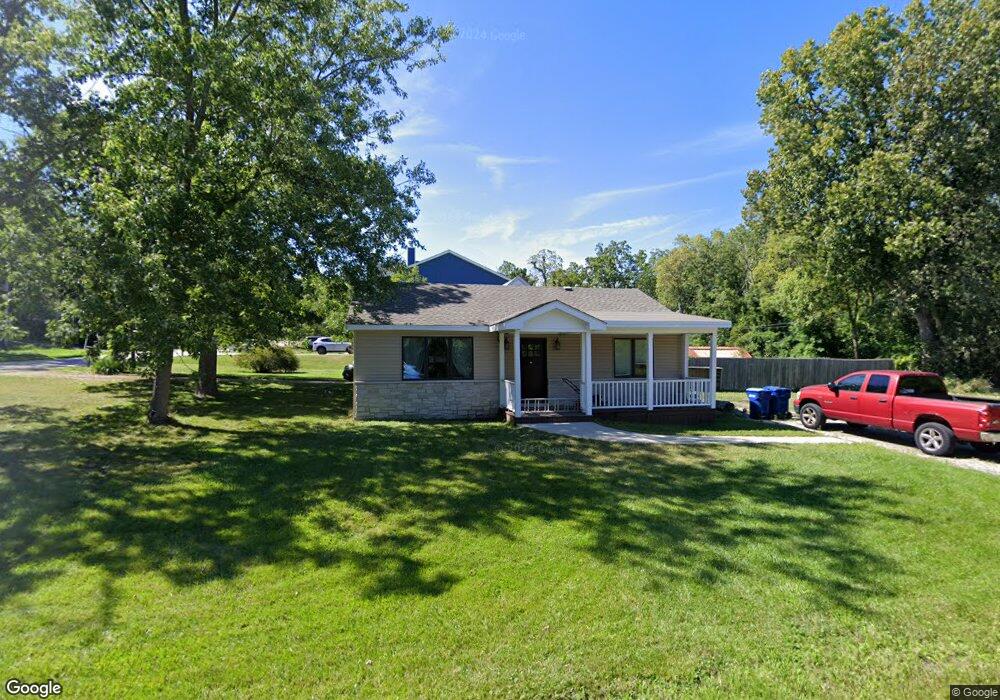
29940 Spring Ln Lake Bluff, IL 60044
Estimated Value: $219,000 - $314,000
Studio
1
Bath
962
Sq Ft
$271/Sq Ft
Est. Value
About This Home
This home is located at 29940 Spring Ln, Lake Bluff, IL 60044 and is currently estimated at $260,537, approximately $270 per square foot. 29940 Spring Ln is a home located in Lake County with nearby schools including Lake Bluff Elementary School, Lake Bluff Middle School, and Lake Forest High School.
Ownership History
Date
Name
Owned For
Owner Type
Purchase Details
Closed on
Oct 17, 2022
Sold by
Brugioni Matthew
Bought by
Lilja Scott
Current Estimated Value
Home Financials for this Owner
Home Financials are based on the most recent Mortgage that was taken out on this home.
Original Mortgage
$160,001
Outstanding Balance
$152,773
Interest Rate
5%
Mortgage Type
FHA
Estimated Equity
$107,764
Purchase Details
Closed on
Sep 29, 2015
Sold by
Noonan Frank A and Noonan George E
Bought by
Brugioni Matthew
Home Financials for this Owner
Home Financials are based on the most recent Mortgage that was taken out on this home.
Original Mortgage
$112,100
Interest Rate
4.5%
Mortgage Type
New Conventional
Purchase Details
Closed on
Jun 21, 1999
Sold by
Noonan Frank A
Bought by
Noonan Frank A and Frank A Noonan Sr Living Trust
Create a Home Valuation Report for This Property
The Home Valuation Report is an in-depth analysis detailing your home's value as well as a comparison with similar homes in the area
Purchase History
| Date | Buyer | Sale Price | Title Company |
|---|---|---|---|
| Lilja Scott | $185,000 | -- | |
| Brugioni Matthew | $118,000 | Precision Title Co | |
| Noonan Frank A | -- | -- |
Source: Public Records
Mortgage History
| Date | Status | Borrower | Loan Amount |
|---|---|---|---|
| Open | Lilja Scott | $160,001 | |
| Previous Owner | Brugioni Matthew | $112,100 |
Source: Public Records
Tax History
| Year | Tax Paid | Tax Assessment Tax Assessment Total Assessment is a certain percentage of the fair market value that is determined by local assessors to be the total taxable value of land and additions on the property. | Land | Improvement |
|---|---|---|---|---|
| 2024 | $3,638 | $68,179 | $26,483 | $41,696 |
| 2023 | $3,324 | $62,850 | $24,413 | $38,437 |
| 2022 | $3,324 | $57,664 | $22,398 | $35,266 |
| 2021 | $3,209 | $57,167 | $22,205 | $34,962 |
| 2020 | $3,145 | $57,483 | $22,328 | $35,155 |
| 2019 | $3,014 | $56,428 | $21,918 | $34,510 |
| 2018 | $2,337 | $46,240 | $24,010 | $22,230 |
| 2017 | $2,291 | $45,467 | $23,609 | $21,858 |
| 2016 | $2,194 | $43,277 | $22,472 | $20,805 |
| 2015 | $1,102 | $40,750 | $21,160 | $19,590 |
| 2014 | $1,087 | $44,179 | $18,997 | $25,182 |
| 2012 | $1,014 | $44,562 | $19,162 | $25,400 |
Source: Public Records
Map
Nearby Homes
- 228 Juneway Terrace
- 233 Kohl Ave
- 188 Melvin Dr
- 307 Forest View Dr
- 55 Trowbridge Cir
- 1061 Green Bay Rd
- 205 Bradford Ct
- 29644 N Birch Ave
- 29599 N Birch Ave
- 117 E Washington Ave
- 510 Sunset Terrace
- 505 Pine Ct
- 349 E Blodgett Ave
- 120 E Scranton Ave Unit 103
- 120 E Scranton Ave Unit 201
- 120 E Scranton Ave Unit 202
- 120 E Scranton Ave Unit 102
- 120 E Scranton Ave Unit 203
- 355 E Blodgett Ave
- 717 Burris Ave
- 1072 Spring Ln
- 224 Juneway Terrace
- 11450 Juneway Terrace
- 226 Juneway Terrace
- 11415 Juneway Terrace
- 11459 W Broadway Ave
- 11455 Juneway Terrace
- 11480 Juneway Terrace
- 11477 Juneway Terrace
- 224 Bayshore Dr
- 227 Juneway Terrace
- 1000 Juneway Terrace
- 29975 Glendell Ave
- 1065 Glendell Ave
- 223 Bayshore Dr
- 29842 Bayshore Dr
- 225 Bayshore Dr
- 232 Bayshore Dr
- 227 Bayshore Dr
- 234 Bayshore Dr
Your Personal Tour Guide
Ask me questions while you tour the home.