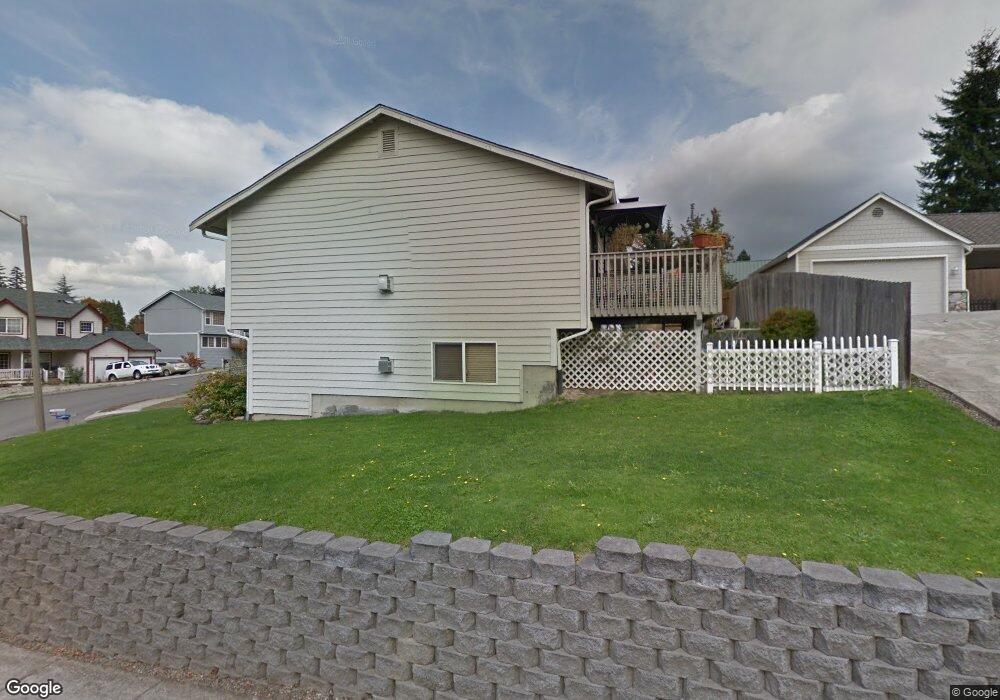
2996 Lowren Loop Port Orchard, WA 98366
Estimated Value: $510,000 - $539,000
3
Beds
3
Baths
2,120
Sq Ft
$245/Sq Ft
Est. Value
About This Home
This home is located at 2996 Lowren Loop, Port Orchard, WA 98366 and is currently estimated at $519,116, approximately $244 per square foot. 2996 Lowren Loop is a home located in Kitsap County with nearby schools including East Port Orchard Elementary School, Marcus Whitman Middle School, and South Kitsap High School.
Ownership History
Date
Name
Owned For
Owner Type
Purchase Details
Closed on
May 11, 2006
Sold by
Blomgren Steven D and Blomgren Allison B
Bought by
Gordon Christopher F and Gordon Beverly A
Current Estimated Value
Home Financials for this Owner
Home Financials are based on the most recent Mortgage that was taken out on this home.
Original Mortgage
$224,800
Outstanding Balance
$130,269
Interest Rate
6.41%
Mortgage Type
Fannie Mae Freddie Mac
Estimated Equity
$388,847
Purchase Details
Closed on
Dec 2, 2002
Sold by
James James T T and James Carol J
Bought by
Blomgren Steven D and Blomgren Allison B
Home Financials for this Owner
Home Financials are based on the most recent Mortgage that was taken out on this home.
Original Mortgage
$173,400
Interest Rate
6.28%
Mortgage Type
VA
Create a Home Valuation Report for This Property
The Home Valuation Report is an in-depth analysis detailing your home's value as well as a comparison with similar homes in the area
Home Values in the Area
Average Home Value in this Area
Purchase History
| Date | Buyer | Sale Price | Title Company |
|---|---|---|---|
| Gordon Christopher F | $281,280 | Land Title Company | |
| Blomgren Steven D | $168,900 | Transnation Title Insurance |
Source: Public Records
Mortgage History
| Date | Status | Borrower | Loan Amount |
|---|---|---|---|
| Open | Gordon Christopher F | $224,800 | |
| Previous Owner | Blomgren Steven D | $173,400 |
Source: Public Records
Tax History Compared to Growth
Tax History
| Year | Tax Paid | Tax Assessment Tax Assessment Total Assessment is a certain percentage of the fair market value that is determined by local assessors to be the total taxable value of land and additions on the property. | Land | Improvement |
|---|---|---|---|---|
| 2026 | $3,919 | $476,920 | $62,400 | $414,520 |
| 2025 | $3,919 | $449,150 | $57,980 | $391,170 |
| 2024 | $3,783 | $449,150 | $57,980 | $391,170 |
| 2023 | $3,780 | $449,150 | $57,980 | $391,170 |
| 2022 | $3,674 | $367,470 | $54,150 | $313,320 |
| 2021 | $3,464 | $328,460 | $50,320 | $278,140 |
| 2020 | $3,402 | $312,810 | $47,920 | $264,890 |
| 2019 | $2,949 | $296,810 | $47,560 | $249,250 |
| 2018 | $3,074 | $238,350 | $47,560 | $190,790 |
| 2017 | $2,612 | $238,350 | $47,560 | $190,790 |
| 2016 | $2,493 | $210,650 | $47,560 | $163,090 |
| 2015 | $2,400 | $206,040 | $47,560 | $158,480 |
| 2014 | -- | $201,420 | $47,560 | $153,860 |
| 2013 | -- | $207,070 | $50,060 | $157,010 |
Source: Public Records
Map
Nearby Homes
- 2949 SE Mile Hill Dr Unit C-2
- 123 E 4th St
- 4990 Mile Hill Dr
- 190 SE Mile Hill Dr
- 0 Wendell Ave SE
- 3817 SE Horstman Rd
- 3140 E Washington St
- 0 E Washington St Unit NWM2337936
- 22 Lots E Washington St
- 3589 SE Pine Tree Dr
- 0 Beach Dr E Unit NWM2448019
- 0 Beach Dr E Unit NWM2139946
- 1663 Harrison Ave SE
- 1703 Harrison Ave SE
- 343 Farragut Ave N
- 4010 SE Lovell St
- 3900 SE Mile Hill Dr
- 4233 SE Horsehead Way
- 3930 SE Mile Hill Dr
- 659 SE Olga Cir
- 0 L24 Lowren Loop
- 0 L4 Lowren Loop
- 0 L34 Lowren Loop
- 0 L26 Lowren Loop
- 0 L23 Lowren Loop
- 0 L30 Lowren Loop
- 0 L22 Lowren Loop
- 0 L11 Lowren Loop
- 0 L14 Lowren Loop
- 0 L13 Lowren Loop
- 0 L3 Lowren Loop
- 0 L1 Lowren Loop
- 2659 Lowren Loop
- 2998 Lowren Loop
- 2939 Lowren Loop
- 2992 Lowren Loop
- 3000 Lowren Loop
- 1030 Olney Ave E
- 2940 Lowren Loop
- 2941 Lowren Loop