G
Seller's Agent in 2020
Gail Hudson
Waddell Haskin & Green Realty, LLC
(706) 322-1414
1 in this area
21 Total Sales
Estimated Value: $276,000 - $289,000
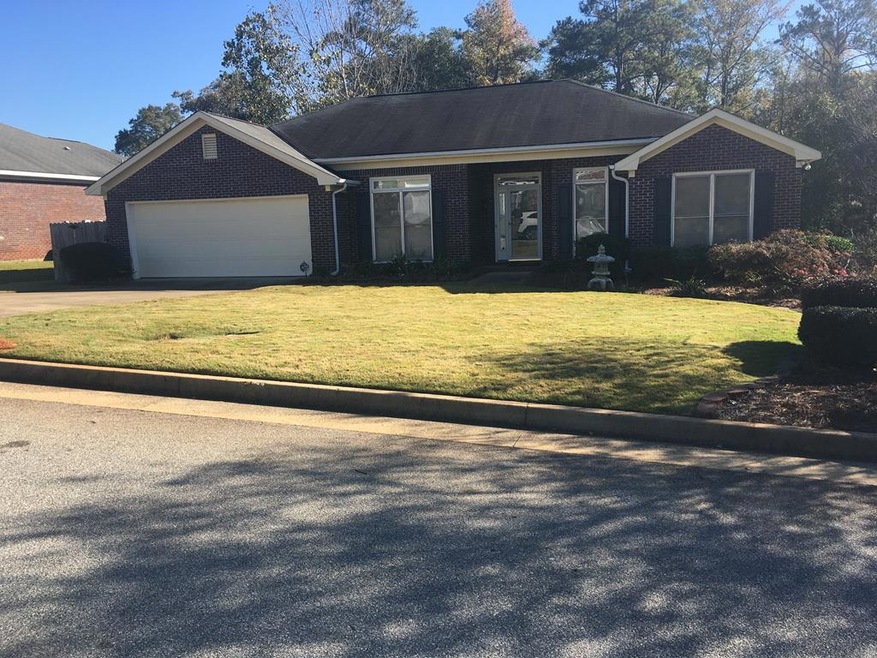
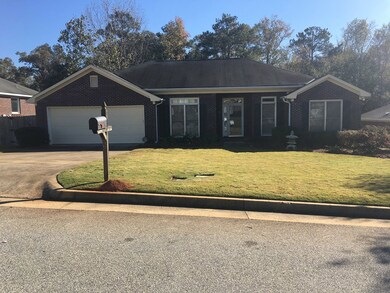
WONDERFULLY MAINTAINED HOME FEATURING AN UPDATED KITCHEN WITH GRANITE COUNTERTOPS, TILE BACKSPLASH, TILE FLOORS AND STAINLESS STEEL APPLIANCES, HARDWOOD FLOORS IN GREAT ROOM AND LIVING ROOM, SPLIT FLOOR PLAN, SPACIOUS MASTER BATH WITH DOUBLE VANITIES, PRIVATE FENCED BACK YARD, BEAUTIFUL LANDSCAPING WITH A SPRINKLER SYSTEM.
Last Agent to Sell the Property
Waddell Haskin & Green Realty, LLC Brokerage Phone: 7062213451 License #203102 Listed on: 11/13/2020
| Date | Buyer | Sale Price | Title Company |
|---|---|---|---|
| Ricca Dominic A | $205,000 | -- | |
| Harper Jon Kurt-Patrick | $185,000 | -- |
| Date | Status | Borrower | Loan Amount |
|---|---|---|---|
| Previous Owner | Harper Jon Kurt-Patrick | $166,500 |
| Date | Event | Price | List to Sale | Price per Sq Ft |
|---|---|---|---|---|
| 12/10/2020 12/10/20 | Sold | $205,000 | -- | $110 / Sq Ft |
| 11/13/2020 11/13/20 | Pending | -- | -- | -- |
| Year | Tax Paid | Tax Assessment Tax Assessment Total Assessment is a certain percentage of the fair market value that is determined by local assessors to be the total taxable value of land and additions on the property. | Land | Improvement |
|---|---|---|---|---|
| 2025 | $3,823 | $97,664 | $16,488 | $81,176 |
| 2024 | $3,823 | $97,664 | $16,488 | $81,176 |
| 2023 | $3,847 | $97,664 | $16,488 | $81,176 |
| 2022 | $3,205 | $78,496 | $16,488 | $62,008 |
| 2021 | $3,275 | $80,216 | $16,488 | $63,728 |
| 2020 | $2,775 | $67,944 | $16,488 | $51,456 |
| 2019 | $2,784 | $67,944 | $16,488 | $51,456 |
| 2018 | $1,533 | $67,944 | $16,488 | $51,456 |
| 2017 | $1,538 | $67,944 | $16,488 | $51,456 |
| 2016 | $1,543 | $58,912 | $10,400 | $48,512 |
| 2015 | $617 | $58,912 | $10,400 | $48,512 |
| 2014 | $617 | $58,912 | $10,400 | $48,512 |
| 2013 | -- | $58,912 | $10,400 | $48,512 |
G
Seller's Agent in 2020
Gail Hudson
Waddell Haskin & Green Realty, LLC
(706) 322-1414
1 in this area
21 Total Sales
S
Buyer's Agent in 2020
Sandi Haskin
Waddell Haskin & Green Realty, LLC
(706) 221-3451
11 in this area
37 Total Sales
Source: Columbus Board of REALTORS® (GA)
MLS Number: 182238
APN: 109-005-028
Disclaimer: Certain information contained herein is derived from information provided by parties other than Homes.com. All information provided is deemed reliable, but is not guaranteed to be accurate and should be independently verified.
![]() IDX information is provided exclusively for personal, non-commercial use, and may not be used for any purpose other than to identify prospective properties consumers may be interested in purchasing. Information is deemed reliable but not guaranteed.
IDX information is provided exclusively for personal, non-commercial use, and may not be used for any purpose other than to identify prospective properties consumers may be interested in purchasing. Information is deemed reliable but not guaranteed.
