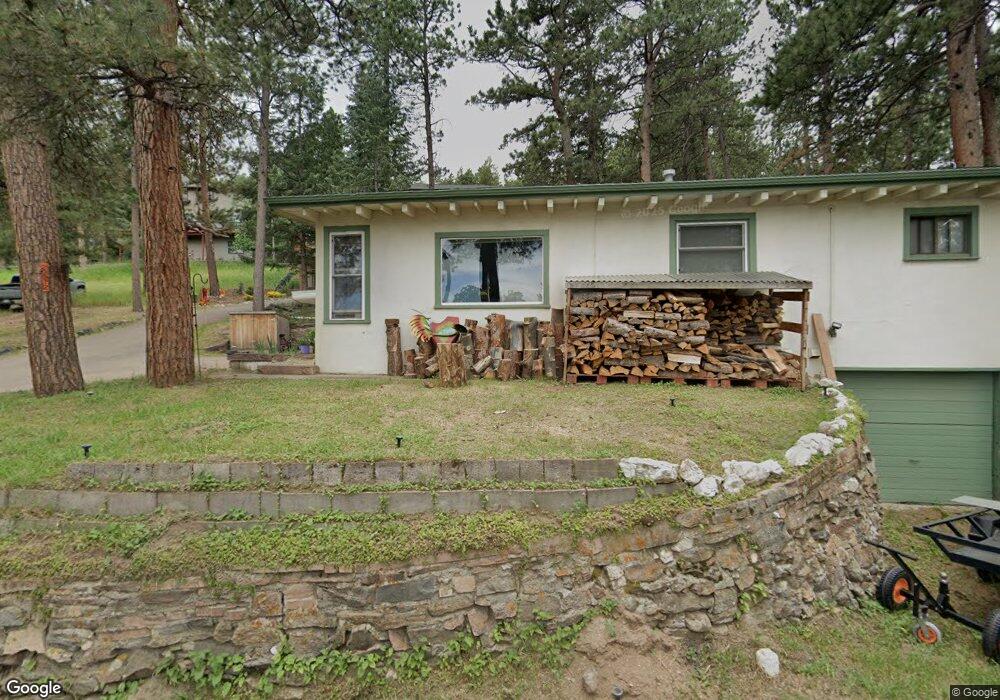
29964 Spruce Rd Evergreen, CO 80439
Estimated Value: $572,000 - $634,000
3
Beds
2
Baths
1,898
Sq Ft
$316/Sq Ft
Est. Value
About This Home
This home is located at 29964 Spruce Rd, Evergreen, CO 80439 and is currently estimated at $599,149, approximately $315 per square foot. 29964 Spruce Rd is a home located in Jefferson County with nearby schools including Bergen Meadow Primary School, Bergen Valley Intermediate School, and Evergreen Middle School.
Ownership History
Date
Name
Owned For
Owner Type
Purchase Details
Closed on
Feb 18, 2015
Sold by
Schwartz Ronnie F
Bought by
Schwartz Ronnie F and Schwartz Kristy J
Current Estimated Value
Home Financials for this Owner
Home Financials are based on the most recent Mortgage that was taken out on this home.
Original Mortgage
$228,000
Interest Rate
3.68%
Mortgage Type
New Conventional
Purchase Details
Closed on
May 25, 2012
Sold by
Lenz Bradley J
Bought by
Schwartz Ronnie F
Home Financials for this Owner
Home Financials are based on the most recent Mortgage that was taken out on this home.
Original Mortgage
$226,118
Interest Rate
4.5%
Mortgage Type
FHA
Purchase Details
Closed on
Aug 30, 2007
Sold by
Lenz Construction Co Inc
Bought by
Lenz Bradley J
Create a Home Valuation Report for This Property
The Home Valuation Report is an in-depth analysis detailing your home's value as well as a comparison with similar homes in the area
Home Values in the Area
Average Home Value in this Area
Purchase History
| Date | Buyer | Sale Price | Title Company |
|---|---|---|---|
| Schwartz Ronnie F | -- | Land Title Guarantee Company | |
| Schwartz Ronnie F | $232,000 | Chicago Title Co | |
| Lenz Bradley J | -- | None Available |
Source: Public Records
Mortgage History
| Date | Status | Borrower | Loan Amount |
|---|---|---|---|
| Previous Owner | Schwartz Ronnie F | $228,000 | |
| Previous Owner | Schwartz Ronnie F | $226,118 |
Source: Public Records
Tax History Compared to Growth
Tax History
| Year | Tax Paid | Tax Assessment Tax Assessment Total Assessment is a certain percentage of the fair market value that is determined by local assessors to be the total taxable value of land and additions on the property. | Land | Improvement |
|---|---|---|---|---|
| 2024 | $3,331 | $36,321 | $6,892 | $29,429 |
| 2023 | $3,331 | $36,321 | $6,892 | $29,429 |
| 2022 | $3,159 | $33,433 | $5,242 | $28,191 |
| 2021 | $3,191 | $34,395 | $5,393 | $29,002 |
| 2020 | $2,662 | $28,466 | $2,548 | $25,918 |
| 2019 | $2,624 | $28,466 | $2,548 | $25,918 |
| 2018 | $2,312 | $24,252 | $2,230 | $22,022 |
| 2017 | $2,105 | $24,252 | $2,230 | $22,022 |
| 2016 | $1,692 | $18,219 | $4,154 | $14,065 |
| 2015 | $1,856 | $18,219 | $4,154 | $14,065 |
| 2014 | $1,856 | $19,393 | $3,744 | $15,649 |
Source: Public Records
Map
Nearby Homes
- 30172 Hilltop Dr
- 3055 Yucca Dr
- 30273 Conifer Rd
- 3046 Sun Creek Ridge
- 32 Sulky Ln
- 3260 Bit Rd
- 2977 Sun Creek Ridge
- 0000 Sun Creek Dr
- 30357 Appaloosa Dr
- 2873 Cortina Ln
- 30584 Sun Creek Dr Unit 12W
- 2667 Keystone Dr
- 32430 Inverness Dr
- 2851 Interlocken Dr
- 29491 Camelback Ln
- 2828 Keystone Dr
- 29210 Northstar Ln
- 3251 Interlocken Dr
- 30593 Golf Club Point
- 3661 Joyful Way Unit D
- 29962 Spruce Rd
- 29973 Fir Dr
- 29972 Spruce Rd
- 29983 Fir Dr
- 29963 Fir Dr
- 30032 Spruce Rd
- 29952 Spruce Rd
- 29981 Fir Dr
- 30062 Spruce Rd
- 29971 Fir Dr
- 30042 Spruce Rd
- 30052 Spruce Rd
- 29973 Spruce Rd
- 3024 S Oxbow Rd
- 29980 Fir Dr
- 0 Spruce Lots 40 41 42 & 43 Rd Unit 3260175
- 0 Spruce Lots 36 37 Part of Lots 16b 17b Rd Unit 8679987
- 29953 Spruce Rd
- 29961 Fir Dr
- 29932 Spruce Rd