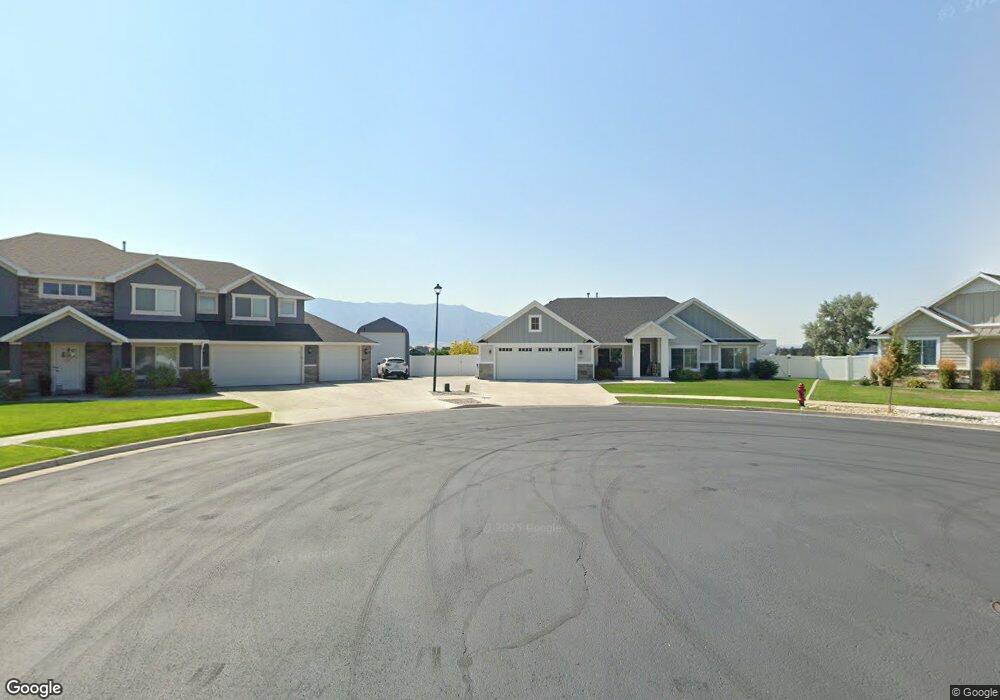
2997 Stonebridge Dr Unit 13 Nibley, UT 84321
Estimated Value: $505,362 - $578,000
--
Bed
--
Bath
1,985
Sq Ft
$275/Sq Ft
Est. Value
About This Home
This home is located at 2997 Stonebridge Dr Unit 13, Nibley, UT 84321 and is currently estimated at $546,091, approximately $275 per square foot. 2997 Stonebridge Dr Unit 13 is a home located in Cache County with nearby schools including Heritage School, South Cache Middle School, and Spring Creek Middle School.
Ownership History
Date
Name
Owned For
Owner Type
Purchase Details
Closed on
Apr 24, 2017
Sold by
Rigby Jacob and Rigby Madelyn
Bought by
Rigby Jacob and Rigby Madelyn
Current Estimated Value
Purchase Details
Closed on
Aug 31, 2016
Sold by
Rigby Bruce
Bought by
Rigby Jacob and Rigby Madelyn
Purchase Details
Closed on
Jul 6, 2016
Sold by
Bank Of Idaho
Bought by
Rigby Jacob and Rigby Madelyn
Purchase Details
Closed on
Apr 16, 2015
Sold by
Stonebridge West Properties Llc
Bought by
Bank Of Idaho and Mike Wolford Ira
Create a Home Valuation Report for This Property
The Home Valuation Report is an in-depth analysis detailing your home's value as well as a comparison with similar homes in the area
Home Values in the Area
Average Home Value in this Area
Purchase History
| Date | Buyer | Sale Price | Title Company |
|---|---|---|---|
| Rigby Jacob | -- | Northern Title Company | |
| Rigby Jacob | -- | None Available | |
| Rigby Jacob | -- | Northern Title Company | |
| Bank Of Idaho | -- | Northern Title Company |
Source: Public Records
Tax History Compared to Growth
Tax History
| Year | Tax Paid | Tax Assessment Tax Assessment Total Assessment is a certain percentage of the fair market value that is determined by local assessors to be the total taxable value of land and additions on the property. | Land | Improvement |
|---|---|---|---|---|
| 2025 | $2,214 | $293,455 | $0 | $0 |
| 2024 | $2,342 | $291,520 | $0 | $0 |
| 2023 | $2,455 | $286,110 | $0 | $0 |
| 2022 | $2,556 | $286,110 | $0 | $0 |
| 2021 | $1,998 | $347,458 | $65,000 | $282,458 |
| 2020 | $1,877 | $310,616 | $65,000 | $245,616 |
| 2019 | $1,968 | $310,616 | $65,000 | $245,616 |
| 2018 | $1,772 | $272,900 | $53,600 | $219,300 |
| 2017 | $1,084 | $88,440 | $0 | $0 |
| 2016 | $1,096 | $50,450 | $0 | $0 |
| 2015 | $621 | $50,450 | $0 | $0 |
| 2014 | $602 | $50,450 | $0 | $0 |
| 2013 | -- | $53,100 | $0 | $0 |
Source: Public Records
Map
Nearby Homes
- 2997 Stonebridge Dr Unit 13
- 2995 Stonebridge Dr Unit 12
- 2995 Stonebridge Dr
- 2995 Stonebridge Dr Unit 12
- 2996 Stonebridge Dr Unit 14
- 1310 W 2930 S Unit 7
- 1301 Nibley Pkwy Unit 114
- 1396 Nibley Pkwy Unit 1
- 1396 Nibley Pkwy
- 1396 Nibley Pkwy Unit 1
- 1396 Nibley Pkwy Unit 1
- 1396 W 2930 S Unit 1
- 1384 Nibley Pkwy
- 2993 Stonebridge Dr
- 2994 Stonebridge Dr Unit 15
- 2992 Stonebridge Dr Unit 16
- 2991 Stonebridge Dr
- 1419 W Crimson Dr Unit 21
- 1419 W Crimson Dr Unit 21
- 1419 W Crimson Dr