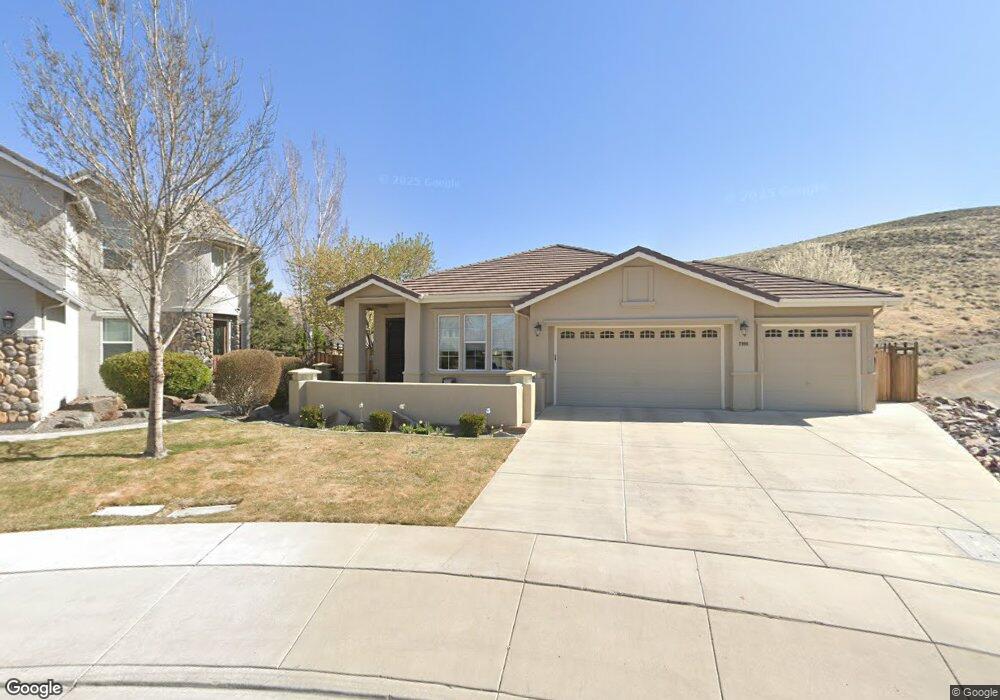
2998 Astronomer Way Unit 21B Sparks, NV 89436
Wingfield Springs NeighborhoodEstimated Value: $603,395 - $678,000
3
Beds
2
Baths
1,971
Sq Ft
$320/Sq Ft
Est. Value
About This Home
This home is located at 2998 Astronomer Way Unit 21B, Sparks, NV 89436 and is currently estimated at $630,599, approximately $319 per square foot. 2998 Astronomer Way Unit 21B is a home located in Washoe County with nearby schools including Van Gorder Elementary School, Sky Ranch Middle School, and Spanish Springs High School.
Ownership History
Date
Name
Owned For
Owner Type
Purchase Details
Closed on
Jan 28, 2020
Sold by
Hawkins Mark A and Hawkins Pamela J
Bought by
Hawkins Mark A and Hawkins Pamela J
Current Estimated Value
Purchase Details
Closed on
Feb 25, 2009
Sold by
Hawkins Mark A and Hawkins Pamela J
Bought by
Hawkins Mark A and Hawkins Pamela J
Home Financials for this Owner
Home Financials are based on the most recent Mortgage that was taken out on this home.
Original Mortgage
$99,700
Interest Rate
5.06%
Mortgage Type
New Conventional
Purchase Details
Closed on
Jan 20, 2004
Sold by
Hawkins Mark A and Hawkins Pamela J
Bought by
Hawkins Mark A and Hawkins Pamela J
Purchase Details
Closed on
Oct 29, 2003
Sold by
Bright Development
Bought by
Hawkins Mark A and Hawkins Pamela J
Home Financials for this Owner
Home Financials are based on the most recent Mortgage that was taken out on this home.
Original Mortgage
$120,000
Interest Rate
5.86%
Mortgage Type
Unknown
Create a Home Valuation Report for This Property
The Home Valuation Report is an in-depth analysis detailing your home's value as well as a comparison with similar homes in the area
Home Values in the Area
Average Home Value in this Area
Purchase History
| Date | Buyer | Sale Price | Title Company |
|---|---|---|---|
| Hawkins Mark A | -- | None Available | |
| Hawkins Mark A | -- | None Available | |
| Hawkins Mark A | -- | First American Title | |
| Hawkins Mark A | $312,500 | First American Title |
Source: Public Records
Mortgage History
| Date | Status | Borrower | Loan Amount |
|---|---|---|---|
| Closed | Hawkins Mark A | $99,700 | |
| Previous Owner | Hawkins Mark A | $120,000 |
Source: Public Records
Tax History Compared to Growth
Tax History
| Year | Tax Paid | Tax Assessment Tax Assessment Total Assessment is a certain percentage of the fair market value that is determined by local assessors to be the total taxable value of land and additions on the property. | Land | Improvement |
|---|---|---|---|---|
| 2026 | -- | $156,066 | $46,375 | $109,691 |
| 2025 | $3,304 | $157,751 | $46,375 | $111,376 |
| 2024 | $3,304 | $150,739 | $38,290 | $112,449 |
| 2023 | $3,209 | $144,780 | $38,850 | $105,930 |
| 2022 | $3,116 | $120,238 | $32,060 | $88,178 |
| 2021 | $3,026 | $116,042 | $28,350 | $87,692 |
| 2020 | $2,936 | $117,208 | $29,470 | $87,738 |
| 2019 | $2,851 | $111,928 | $27,615 | $84,313 |
| 2018 | $2,767 | $102,403 | $19,845 | $82,558 |
| 2017 | $2,656 | $100,328 | $18,655 | $81,673 |
| 2016 | $2,587 | $101,006 | $17,675 | $83,331 |
| 2015 | $651 | $90,102 | $15,400 | $74,702 |
| 2014 | $2,509 | $79,102 | $13,195 | $65,907 |
| 2013 | -- | $61,876 | $10,710 | $51,166 |
Source: Public Records
Map
Nearby Homes
- 2910 Albazano Ct
- 5989 Solstice Dr
- 5465 Spirit Ct
- 6036 Cielo Cir
- 5448 Fossilstone Dr
- 5410 Cactus Quartz Ct
- 2661 Lawry Dr
- 2353 Old Waverly Dr
- The Heights, Plan 3X at The Heights
- The Heights, Plan 2 at The Heights
- The Heights, Plan 1X at The Heights
- The Heights, Plan 1 at The Heights
- The Heights, Plan 4 at The Heights
- The Heights, Plan 3 at The Heights
- 6302 Cokenee Ct
- 5688 Spandrell Cir
- 6313 Bonita Ct
- 6375 N Ginger Quill Ct
- 6348 Chilhowee Ct
- 6325 Firebee Ct
- 2988 Astronomer Way Unit 21B
- 2989 Astronomer Way
- 2978 Astronomer Way
- 5835 Single Foot Ct Unit 5835
- 5835 Single Foot Ct
- 5835 Single Foot Ct Unit 2215
- 2979 Astronomer Way
- 5829 Single Foot Ct
- 2968 Astronomer Way Unit 21B
- 2969 Astronomer Way
- 2958 Astronomer Way
- 2959 Astronomer Way Unit 21B
- 5825 Single Foot Ct
- 5855 Single Foot Ct
- 2948 Astronomer Way
- 2949 Astronomer Way
- 2921 Albazano Ct
- 5830 Single Foot Ct
- 2938 Astronomer Way
- 5865 Single Foot Ct