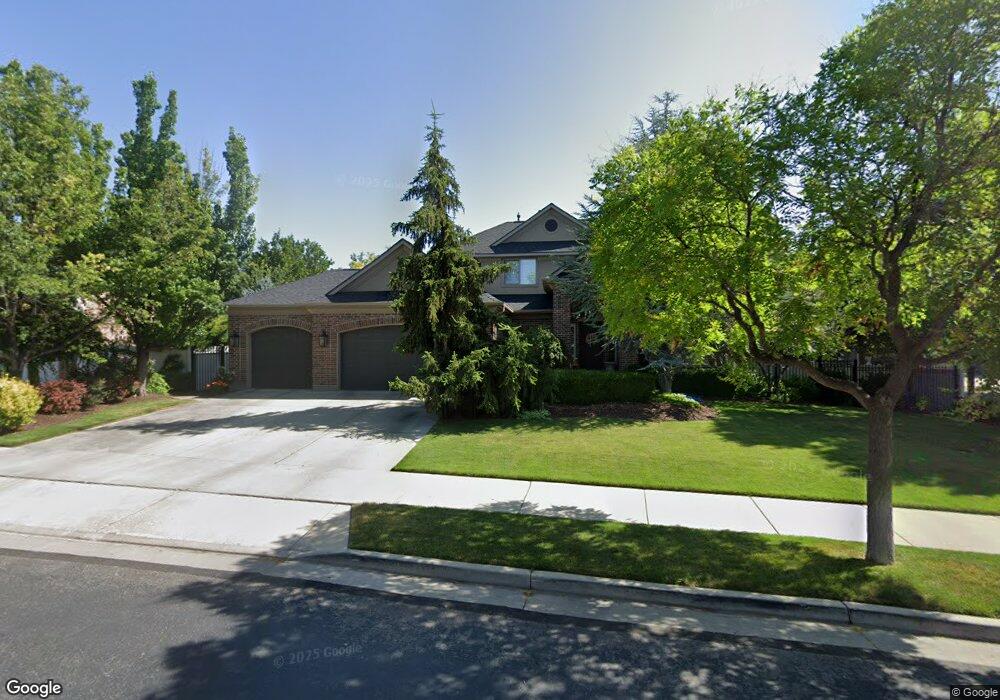
2998 Wilkins Peak Ct South Jordan, UT 84095
Estimated Value: $965,000 - $1,016,000
4
Beds
3
Baths
2,859
Sq Ft
$349/Sq Ft
Est. Value
About This Home
This home is located at 2998 Wilkins Peak Ct, South Jordan, UT 84095 and is currently estimated at $996,632, approximately $348 per square foot. 2998 Wilkins Peak Ct is a home located in Salt Lake County with nearby schools including Monte Vista Elementary School, South Jordan Middle School, and Mountain West Montessori Academy.
Ownership History
Date
Name
Owned For
Owner Type
Purchase Details
Closed on
Sep 16, 2010
Sold by
Sudbury Scott R and Sudbury Stefanie Weston
Bought by
Sudbury Scott R and Sudbury Stefanie Weston
Current Estimated Value
Home Financials for this Owner
Home Financials are based on the most recent Mortgage that was taken out on this home.
Original Mortgage
$294,000
Outstanding Balance
$183,334
Interest Rate
3.37%
Mortgage Type
New Conventional
Estimated Equity
$813,298
Purchase Details
Closed on
Dec 23, 2004
Sold by
Ivory Homes Ltd
Bought by
Sudbury Scott R and Sudbury Stefanie Weston
Home Financials for this Owner
Home Financials are based on the most recent Mortgage that was taken out on this home.
Original Mortgage
$295,500
Interest Rate
4.87%
Mortgage Type
Purchase Money Mortgage
Create a Home Valuation Report for This Property
The Home Valuation Report is an in-depth analysis detailing your home's value as well as a comparison with similar homes in the area
Home Values in the Area
Average Home Value in this Area
Purchase History
| Date | Buyer | Sale Price | Title Company |
|---|---|---|---|
| Sudbury Scott R | -- | First American Title | |
| Sudbury Scott R | -- | Cottonwood Title Ins Agency |
Source: Public Records
Mortgage History
| Date | Status | Borrower | Loan Amount |
|---|---|---|---|
| Open | Sudbury Scott R | $294,000 | |
| Closed | Sudbury Scott R | $295,500 |
Source: Public Records
Tax History Compared to Growth
Tax History
| Year | Tax Paid | Tax Assessment Tax Assessment Total Assessment is a certain percentage of the fair market value that is determined by local assessors to be the total taxable value of land and additions on the property. | Land | Improvement |
|---|---|---|---|---|
| 2025 | $4,592 | $931,300 | $250,900 | $680,400 |
| 2024 | $4,592 | $871,900 | $239,000 | $632,900 |
| 2023 | $4,572 | $819,100 | $232,000 | $587,100 |
| 2022 | $4,707 | $826,400 | $227,500 | $598,900 |
| 2021 | $3,795 | $611,400 | $188,000 | $423,400 |
| 2020 | $3,732 | $563,600 | $188,000 | $375,600 |
| 2019 | $3,652 | $542,100 | $177,900 | $364,200 |
| 2018 | $3,467 | $512,000 | $176,900 | $335,100 |
| 2017 | $3,412 | $493,900 | $173,900 | $320,000 |
| 2016 | $3,613 | $495,600 | $160,700 | $334,900 |
| 2015 | $3,028 | $403,800 | $162,300 | $241,500 |
| 2014 | $3,295 | $431,900 | $154,700 | $277,200 |
Source: Public Records
Map
Nearby Homes
- 3028 W Wilkins Peak Ct
- 2817 W 11460 St S Unit 203
- 3312 W Country Bluff Rd
- 2732 W Lizzi Cove
- 2834 Proudest Ln Unit 247
- 11513 S Jackson Downs Way
- 3407 W Pazos Cir Unit 4
- 11159 Via Encantada Way
- 2602 W 11625 S
- 2626 W Midas Side Way
- 3168 Chalk Creek Way
- 3371 W Waterbridge Cove Unit 417
- 2410 W 11400 S
- 11716 S 2610 W
- 10868 Reta View Ct Unit 232
- 3376 W Water Crescent Place
- 3550 W Franco Court #2
- 3558 W Via Bello Ct
- 3537 W Sojo Dr
- Beatrix Plan at McKee Farms
- 11272 S Alta Peak Rd
- 11272 Alta Peak Rd
- 3012 Wilkins Peak Ct
- 3009 Wilkins Peak Ct
- 11289 S Alta Peak Rd
- 11289 Alta Peak Rd
- 11301 Alta Peak Rd
- 11301 S Alta Peak Rd
- 11277 Alta Peak Rd
- 11277 S Alta Peak Rd
- 11256 Alta Peak Rd
- 3011 Riviera Pass Cir
- 11256 S Alta Peak Rd
- 3028 Wilkins Peak Ct
- 3029 Wilkins Peak Ct
- 11263 S Alta Peak Rd
- 11263 Alta Peak Rd
- 11319 Alta Peak Rd
- 11319 S Alta Peak Rd
- 11317 S Springer Ln