29981 Center Ridge Rd Westlake, OH 44145
Estimated Value: $260,280 - $306,000
2
Beds
3
Baths
1,772
Sq Ft
$159/Sq Ft
Est. Value
About This Home
This home is located at 29981 Center Ridge Rd, Westlake, OH 44145 and is currently estimated at $281,070, approximately $158 per square foot. 29981 Center Ridge Rd is a home located in Cuyahoga County with nearby schools including Dover Intermediate School, Lee Burneson Middle School, and Westlake High School.
Ownership History
Date
Name
Owned For
Owner Type
Purchase Details
Closed on
Feb 19, 2019
Sold by
Dilling Matthew J
Bought by
Opaskar Amanda M
Current Estimated Value
Home Financials for this Owner
Home Financials are based on the most recent Mortgage that was taken out on this home.
Original Mortgage
$160,550
Outstanding Balance
$140,864
Interest Rate
4.4%
Mortgage Type
New Conventional
Estimated Equity
$140,206
Purchase Details
Closed on
Aug 26, 1999
Sold by
Mayher Kathleen
Bought by
Dilling Matthew J
Home Financials for this Owner
Home Financials are based on the most recent Mortgage that was taken out on this home.
Original Mortgage
$100,000
Interest Rate
7.61%
Purchase Details
Closed on
Aug 31, 1987
Sold by
Stevens James G
Bought by
Mayher Kathleen
Purchase Details
Closed on
Jan 1, 1986
Bought by
Stevens James G
Create a Home Valuation Report for This Property
The Home Valuation Report is an in-depth analysis detailing your home's value as well as a comparison with similar homes in the area
Home Values in the Area
Average Home Value in this Area
Purchase History
| Date | Buyer | Sale Price | Title Company |
|---|---|---|---|
| Opaskar Amanda M | $169,000 | Cleveland Home Title | |
| Dilling Matthew J | $125,000 | Guardian Title | |
| Mayher Kathleen | $92,000 | -- | |
| Stevens James G | -- | -- |
Source: Public Records
Mortgage History
| Date | Status | Borrower | Loan Amount |
|---|---|---|---|
| Open | Opaskar Amanda M | $160,550 | |
| Previous Owner | Dilling Matthew J | $100,000 |
Source: Public Records
Tax History Compared to Growth
Tax History
| Year | Tax Paid | Tax Assessment Tax Assessment Total Assessment is a certain percentage of the fair market value that is determined by local assessors to be the total taxable value of land and additions on the property. | Land | Improvement |
|---|---|---|---|---|
| 2024 | $3,822 | $80,255 | $8,015 | $72,240 |
| 2023 | $3,278 | $59,160 | $7,110 | $52,050 |
| 2022 | $3,226 | $59,150 | $7,110 | $52,050 |
| 2021 | $3,230 | $59,150 | $7,110 | $52,050 |
| 2020 | $3,241 | $54,460 | $5,460 | $49,000 |
| 2019 | $3,143 | $155,600 | $15,600 | $140,000 |
| 2018 | $2,962 | $54,460 | $5,460 | $49,000 |
| 2017 | $2,798 | $45,400 | $4,520 | $40,880 |
| 2016 | $2,783 | $45,400 | $4,520 | $40,880 |
| 2015 | $2,768 | $45,400 | $4,520 | $40,880 |
| 2014 | $3,115 | $49,880 | $4,970 | $44,910 |
Source: Public Records
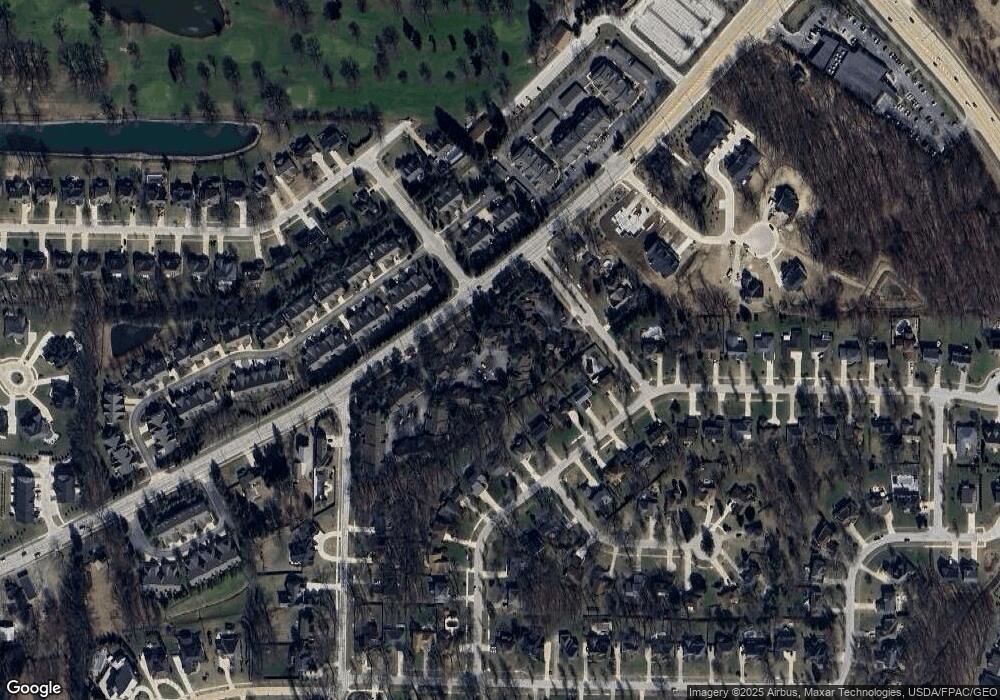
Map
Nearby Homes
- 30029 Shadow Creek Dr Unit 34
- ABBY TH Plan at Brentwood - Brentwood Townhomes
- LUCAS TH Plan at Brentwood - Brentwood Townhomes
- LIBBY TH Plan at Brentwood - Brentwood Townhomes
- 4352 Palomar Cir
- 4324 Palomar Ln
- 29852 Lenox Dr
- 4336 Palomar Cir
- 4340 Palomar Cir
- 4340 Palomar Ln
- 30233 Center Ridge Rd Unit 5
- S/L A Mallard Cove
- S/L Y Carlton Ave
- S/L Carlton Ave
- 30492 Carlton Ave
- Lyon Plan at Carlton Estates
- Bourges Plan at Carlton Estates
- Deer Valley Plan at Carlton Estates
- Woodside Plan at Carlton Estates
- Willwood Plan at Carlton Estates
- 29981 Center Ridge Rd Unit 29981B
- 29981 Center Ridge Rd
- 29981 Center Ridge Rd
- 29981 Center Ridge Rd Unit C
- 29981 Center Ridge Rd Unit B
- 29981 Center Ridge Rd Unit D
- 4504 Hope Ct
- 4488 Hope Ct
- 4491 Hope Ct
- 4486 Rowan Way
- 4482 Rowan Way
- 4485 Rowan Way
- 30017 Center Ridge Rd
- 30017 Center Ridge Rd
- 30017 Center Ridge Rd
- 30017 Center Ridge Rd
- 30017 Center Ridge Rd
- 30017 Center Ridge Rd
- 30017 Center Ridge Rd Unit C
- 30017 Center Ridge Rd Unit E