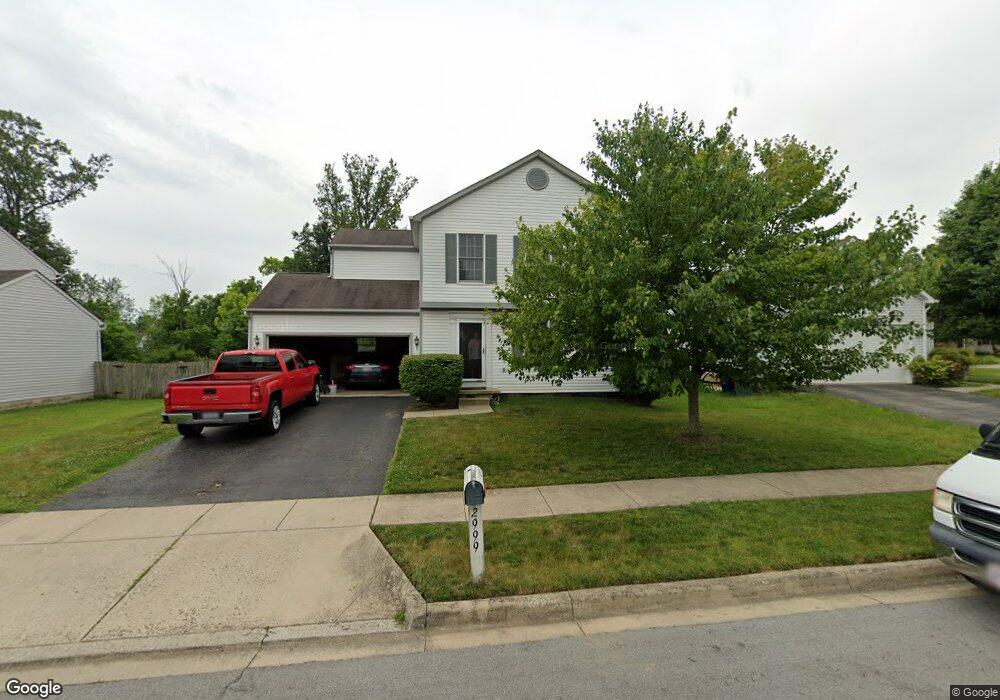
2999 Crocker Run Rd Grove City, OH 43123
Estimated Value: $295,765 - $311,000
4
Beds
3
Baths
1,471
Sq Ft
$206/Sq Ft
Est. Value
About This Home
This home is located at 2999 Crocker Run Rd, Grove City, OH 43123 and is currently estimated at $302,441, approximately $205 per square foot. 2999 Crocker Run Rd is a home located in Franklin County with nearby schools including Highland Park Elementary School, Park Street Intermediate School, and Central Crossing High School.
Ownership History
Date
Name
Owned For
Owner Type
Purchase Details
Closed on
Jun 2, 2022
Sold by
Washington Jr Bobbie T and Washington Jennifer R
Bought by
Washington Bobbie T and Washington Jennifer R
Current Estimated Value
Purchase Details
Closed on
May 26, 2022
Sold by
Washington Jr Bobbie T and Washington Jennifer R
Bought by
Washington Bobbie T and Washington Jennifer R
Purchase Details
Closed on
Nov 27, 2009
Sold by
Wilgus Brian T and Wilgus Jennifer A
Bought by
Washington Bobbie T
Home Financials for this Owner
Home Financials are based on the most recent Mortgage that was taken out on this home.
Original Mortgage
$102,400
Interest Rate
5.05%
Mortgage Type
New Conventional
Purchase Details
Closed on
Mar 8, 1999
Sold by
Dominion Homes Inc
Bought by
Wilgus Brian T and Wilgus Jennifer A
Home Financials for this Owner
Home Financials are based on the most recent Mortgage that was taken out on this home.
Original Mortgage
$117,000
Interest Rate
6.83%
Create a Home Valuation Report for This Property
The Home Valuation Report is an in-depth analysis detailing your home's value as well as a comparison with similar homes in the area
Home Values in the Area
Average Home Value in this Area
Purchase History
| Date | Buyer | Sale Price | Title Company |
|---|---|---|---|
| Washington Bobbie T | -- | Waugh Law Llc | |
| Washington Bobbie T | -- | Waugh Law Llc | |
| Washington Bobbie T | $128,000 | Attorney | |
| Wilgus Brian T | $132,600 | Alliance Title |
Source: Public Records
Mortgage History
| Date | Status | Borrower | Loan Amount |
|---|---|---|---|
| Previous Owner | Washington Bobbie T | $102,400 | |
| Previous Owner | Wilgus Brian T | $117,000 |
Source: Public Records
Tax History Compared to Growth
Tax History
| Year | Tax Paid | Tax Assessment Tax Assessment Total Assessment is a certain percentage of the fair market value that is determined by local assessors to be the total taxable value of land and additions on the property. | Land | Improvement |
|---|---|---|---|---|
| 2024 | $2,878 | $78,930 | $21,000 | $57,930 |
| 2023 | $2,827 | $78,925 | $21,000 | $57,925 |
| 2022 | $2,626 | $53,800 | $9,660 | $44,140 |
| 2021 | $2,678 | $53,800 | $9,660 | $44,140 |
| 2020 | $2,663 | $53,800 | $9,660 | $44,140 |
| 2019 | $2,500 | $44,560 | $8,050 | $36,510 |
| 2018 | $2,428 | $44,560 | $8,050 | $36,510 |
| 2017 | $2,477 | $44,560 | $8,050 | $36,510 |
| 2016 | $2,368 | $39,140 | $8,300 | $30,840 |
| 2015 | $2,368 | $39,140 | $8,300 | $30,840 |
| 2014 | $2,370 | $39,140 | $8,300 | $30,840 |
| 2013 | $1,306 | $43,470 | $9,205 | $34,265 |
Source: Public Records
Map
Nearby Homes
- 0 Glencreek Rd
- 2195 Big Run Ave
- 1761 Arrowhead Dr
- 2236 Maribeth Place
- 2930 Alkire Rd
- 2117 Drumlin Dr
- 2154 Drumlin Dr
- 1520 Fall Brook Rd
- 3339 Joes Way
- 3246 Bluhm Ct
- 3434 Royal Hill Dr
- 2364 Nedra St
- 1657 Ripplebrook Rd
- 2272 Topaz Dr
- 3816 Miltonsburg Dr
- 3159 Vauxhall Dr
- 2987 Daisy Ln
- 4745 Big Run Rd E
- 2856 Chesfield Dr
- 2408 Warfield Dr
- 3005 Crocker Run Rd
- 2993 Crocker Run Rd
- 2987 Crocker Run Rd
- 1948 Beauregard Blvd
- 3002 Crocker Run Rd
- 2996 Crocker Run Rd
- 3008 Crocker Run Rd
- 2981 Crocker Run Rd
- 2990 Crocker Run Rd
- 1915 Beauregard Blvd
- 1923 Beauregard Blvd
- 1907 Beauregard Blvd
- 1931 Beauregard Blvd
- 2975 Crocker Run Rd
- 1899 Beauregard Blvd
- 1939 Beauregard Blvd
- 2978 Crocker Run Rd
- 2079 Sondra Ln
- 2071 Sondra Ln
- 1891 Beauregard Blvd