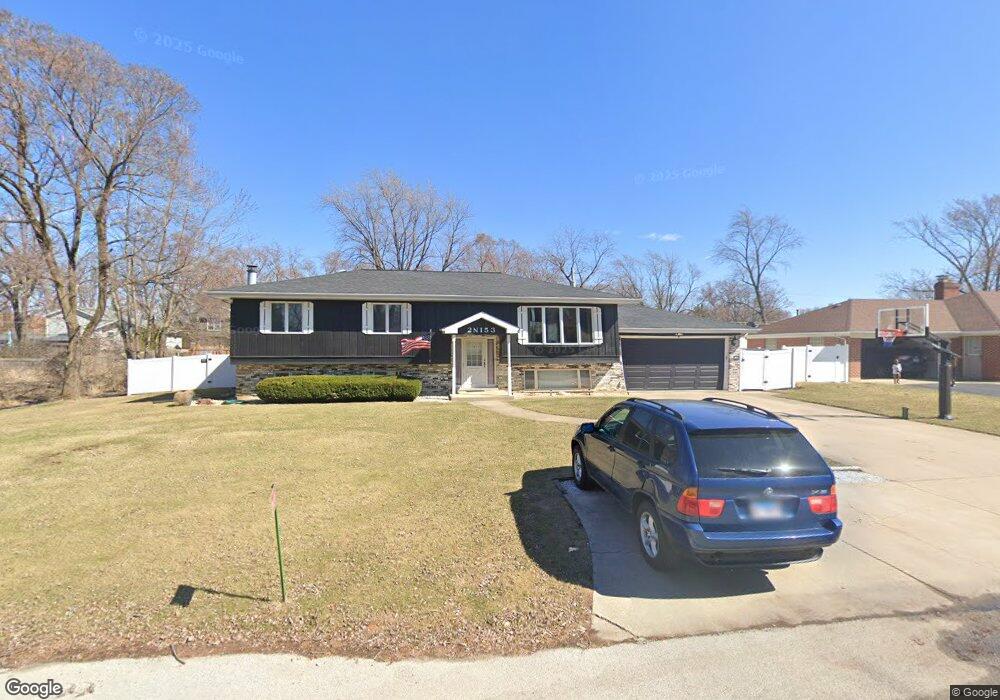
2N153 Joyce Ave Lombard, IL 60148
North Lombard NeighborhoodEstimated Value: $418,000 - $551,000
4
Beds
3
Baths
2,200
Sq Ft
$210/Sq Ft
Est. Value
About This Home
This home is located at 2N153 Joyce Ave, Lombard, IL 60148 and is currently estimated at $462,128, approximately $210 per square foot. 2N153 Joyce Ave is a home located in DuPage County with nearby schools including Ardmore Elementary School, Indian Trail Jr High School, and Addison Trail High School.
Ownership History
Date
Name
Owned For
Owner Type
Purchase Details
Closed on
Jun 30, 2017
Sold by
Malinowski John J and Malinowski Cindy A
Bought by
Wingfield Alfonse F and Eno Christina A
Current Estimated Value
Purchase Details
Closed on
Dec 18, 2000
Sold by
Hudson Maria T
Bought by
Malinowski John J
Home Financials for this Owner
Home Financials are based on the most recent Mortgage that was taken out on this home.
Original Mortgage
$110,000
Interest Rate
7.8%
Purchase Details
Closed on
Jul 19, 2000
Sold by
Hudson Steven R
Bought by
Hudson Maria T
Purchase Details
Closed on
May 25, 1995
Sold by
Cosmopolitan Bank & Trust
Bought by
Hudson Steven R and Hudson Maria T
Home Financials for this Owner
Home Financials are based on the most recent Mortgage that was taken out on this home.
Original Mortgage
$115,000
Interest Rate
7.75%
Create a Home Valuation Report for This Property
The Home Valuation Report is an in-depth analysis detailing your home's value as well as a comparison with similar homes in the area
Home Values in the Area
Average Home Value in this Area
Purchase History
| Date | Buyer | Sale Price | Title Company |
|---|---|---|---|
| Wingfield Alfonse F | $280,000 | Old Republic National Title | |
| Malinowski John J | $200,000 | -- | |
| Hudson Maria T | -- | -- | |
| Hudson Steven R | -- | Intercounty Title |
Source: Public Records
Mortgage History
| Date | Status | Borrower | Loan Amount |
|---|---|---|---|
| Previous Owner | Malinowski John J | $110,000 | |
| Previous Owner | Hudson Steven R | $115,000 |
Source: Public Records
Tax History Compared to Growth
Tax History
| Year | Tax Paid | Tax Assessment Tax Assessment Total Assessment is a certain percentage of the fair market value that is determined by local assessors to be the total taxable value of land and additions on the property. | Land | Improvement |
|---|---|---|---|---|
| 2024 | $6,228 | $118,244 | $26,738 | $91,506 |
| 2023 | $5,933 | $108,700 | $24,580 | $84,120 |
| 2022 | $5,306 | $101,720 | $22,860 | $78,860 |
| 2021 | $5,066 | $97,440 | $21,900 | $75,540 |
| 2020 | $4,920 | $93,340 | $20,980 | $72,360 |
| 2019 | $4,941 | $89,750 | $20,170 | $69,580 |
| 2018 | $5,521 | $91,090 | $20,170 | $70,920 |
| 2017 | $5,401 | $87,060 | $19,280 | $67,780 |
| 2016 | $5,254 | $80,380 | $17,800 | $62,580 |
| 2015 | $5,140 | $74,250 | $16,440 | $57,810 |
| 2014 | $4,991 | $71,510 | $16,950 | $54,560 |
| 2013 | $4,903 | $72,970 | $17,300 | $55,670 |
Source: Public Records
Map
Nearby Homes
- 2N000 Vista Ave
- 933 W North Ave Unit A
- 937 W North Ave Unit C
- 630 E Le Moyne Ave
- 343 E North Ave
- 530 N Fairfield Ave
- 439 N Fairfield Ave
- 434 N Lincoln Ave
- 739 N 2nd Ave
- 231 E Berkshire Ave
- 426 S Adeline Ave
- 506 N Garfield St
- 546 N Main St
- 921 S Iowa Ave
- 913 S Iowa Ave
- 2N152 Wisconsin Ave
- 426 W Fullerton Ave
- 147 W North Ave
- 300 W Fullerton Ave Unit 222
- 124 W Sunset Ave
- 2N076 Joyce St
- 2N153 Joyce St
- 2N135 Joyce St
- 2N150 Joyce St
- 2N161 Joyce St
- 2N160 Edgewood Ave Unit 2A
- 2N261 Joyce St
- 2N138 Joyce St
- 2N160 Joyce St
- 2N130 Edgewood Ave
- 2N263 Joyce St
- 2N176 Edgewood Ave
- 2N259 Joyce St
- 2N109 Joyce St
- 2N120 Edgewood Ave
- 2N110 Joyce St
- 2N110 Fairfield Ave
- 2N137 Fairfield Ave
- 2N137 Fairfield Ave