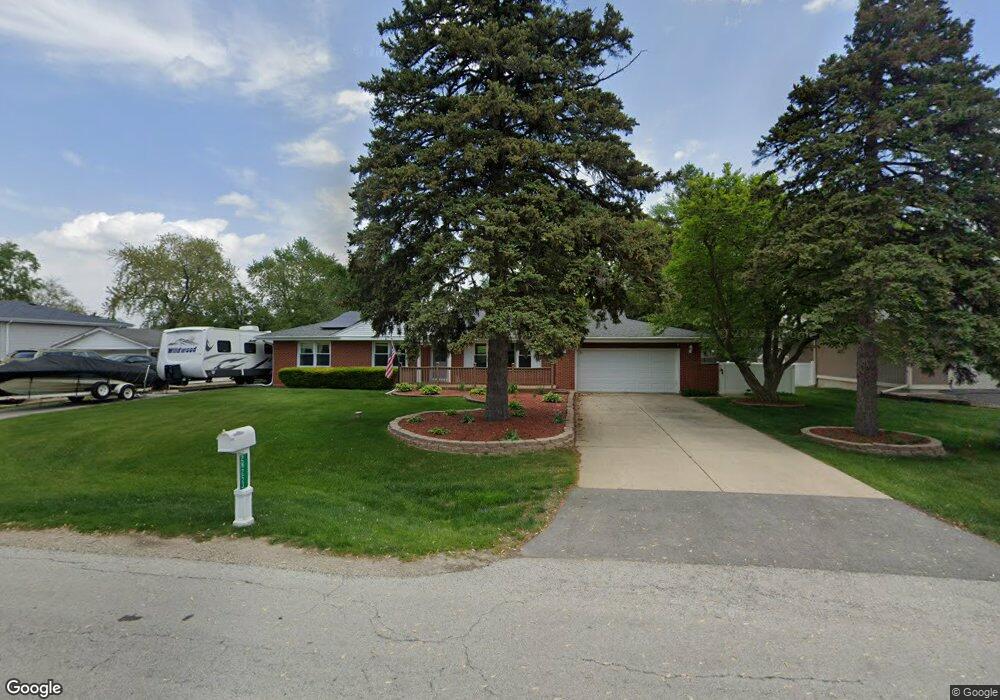
2N253 Mildred Ave Glen Ellyn, IL 60137
Estimated Value: $437,415 - $523,000
3
Beds
3
Baths
1,615
Sq Ft
$293/Sq Ft
Est. Value
About This Home
This home is located at 2N253 Mildred Ave, Glen Ellyn, IL 60137 and is currently estimated at $473,104, approximately $292 per square foot. 2N253 Mildred Ave is a home located in DuPage County with nearby schools including Glen Hill Primary School, Americana Intermediate School, and Glenside Middle School.
Ownership History
Date
Name
Owned For
Owner Type
Purchase Details
Closed on
Sep 13, 2018
Sold by
Streicher Matthew and Heller Amanda R
Bought by
Streicher Matthew and Streicher Amanda R
Current Estimated Value
Purchase Details
Closed on
Feb 3, 2017
Sold by
Rodriguez Javier and Rodriguez Annie
Bought by
Streicher Matthew and Heller Amanda R
Home Financials for this Owner
Home Financials are based on the most recent Mortgage that was taken out on this home.
Original Mortgage
$224,000
Outstanding Balance
$185,046
Interest Rate
4.12%
Mortgage Type
New Conventional
Estimated Equity
$288,058
Purchase Details
Closed on
Jan 23, 2014
Sold by
Rodriguez Annie and Estate Of Dona Knapik
Bought by
Rodriguez Javier and Rodriguez Annie
Purchase Details
Closed on
Sep 21, 2010
Sold by
Knapik Dona T and Estate Of Diana H Salerno
Bought by
Knapik Dona T
Create a Home Valuation Report for This Property
The Home Valuation Report is an in-depth analysis detailing your home's value as well as a comparison with similar homes in the area
Home Values in the Area
Average Home Value in this Area
Purchase History
| Date | Buyer | Sale Price | Title Company |
|---|---|---|---|
| Streicher Matthew | -- | Attorney | |
| Streicher Matthew | $280,000 | Fort Dearborn Title | |
| Rodriguez Javier | -- | None Available | |
| Knapik Dona T | -- | None Available |
Source: Public Records
Mortgage History
| Date | Status | Borrower | Loan Amount |
|---|---|---|---|
| Open | Streicher Matthew | $224,000 |
Source: Public Records
Tax History
| Year | Tax Paid | Tax Assessment Tax Assessment Total Assessment is a certain percentage of the fair market value that is determined by local assessors to be the total taxable value of land and additions on the property. | Land | Improvement |
|---|---|---|---|---|
| 2024 | $10,898 | $137,453 | $32,707 | $104,746 |
| 2023 | $10,553 | $125,700 | $29,910 | $95,790 |
| 2022 | $10,394 | $119,220 | $28,630 | $90,590 |
| 2021 | $8,567 | $99,950 | $27,200 | $72,750 |
| 2020 | $7,876 | $93,330 | $26,540 | $66,790 |
| 2019 | $7,948 | $93,330 | $25,500 | $67,830 |
| 2018 | $9,629 | $100,320 | $24,840 | $75,480 |
| 2017 | $9,341 | $92,980 | $23,020 | $69,960 |
| 2016 | $9,047 | $86,050 | $21,300 | $64,750 |
| 2015 | $8,897 | $80,300 | $19,880 | $60,420 |
| 2014 | $8,912 | $79,710 | $19,880 | $59,830 |
| 2013 | $8,822 | $82,440 | $20,560 | $61,880 |
Source: Public Records
Map
Nearby Homes
- 1455 Bloomingdale Rd
- 118 Windsor Ln
- 2N309 Pearl Ave
- 71 Cambridge Ln
- 1295 Pearl Ave Unit D
- 419 Sidney Ave Unit C
- 1N713 Evergreen Ave
- 2N356 Prairie Ave
- 45 Cambridge Ln
- 1348 Hartford St
- 2N643 Diane Ave
- 461 James Ct Unit D
- 1130 Evergreen Ave Unit 1A
- 2N631 Virginia Ave
- 1111 Bloomingdale Rd Unit 2A
- 1111 Bloomingdale Rd Unit 2B
- 142 Kennebunk Ct Unit 32
- 46 Joseph Ln
- 1159 Harbor Ct Unit 102
- 277 Shorewood Dr Unit 2A
- 2N253 Mildred Ave
- 2N265 Mildred Ave
- 2N252 Mildred Ave
- 2N240 Mildred Ave
- 2N225 Mildred Ave
- 2N281 Mildred Ave
- 2N240 Diane Ave
- 2N266 Mildred Ave
- 2N226 Mildred Ave
- 2N264 Diane Ave
- 2N226 Diane Ave
- 2N280 Mildred Ave
- 23W312 Sidney Ave
- 2N306 Mildred Ave
- 2N286 Diane Ave
- 2N216 Mildred Ave Unit 3
- 23W276 Sidney Ave
- 2N241 Diane Ave
- 1335 Bloomingdale Rd
- 2N269 Diane Ave
Your Personal Tour Guide
Ask me questions while you tour the home.