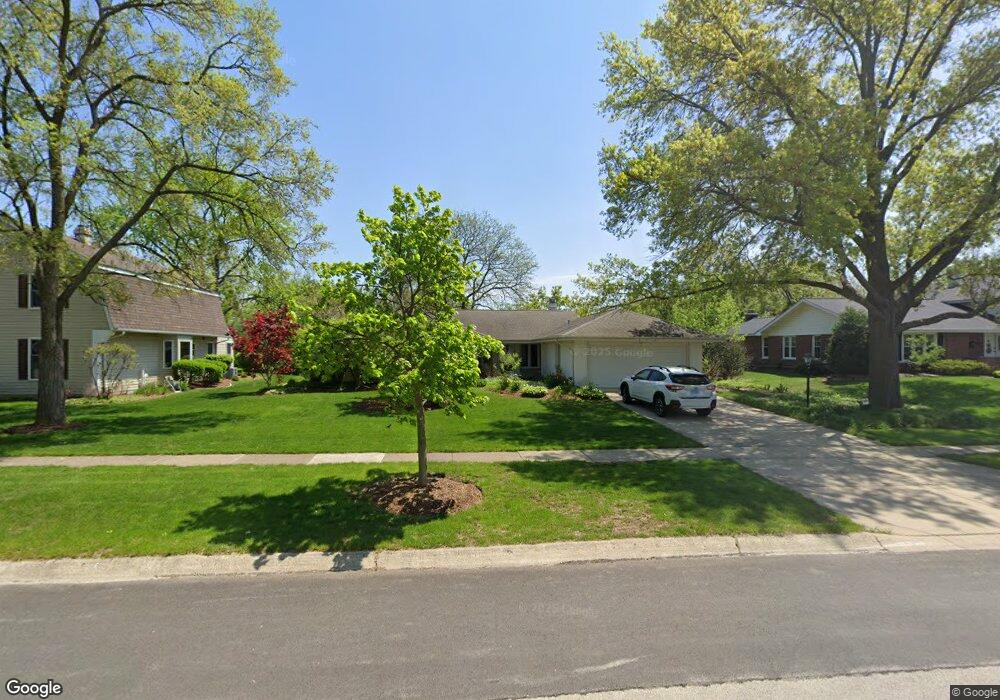
2S041 Taylor Rd Glen Ellyn, IL 60137
Estimated Value: $538,937 - $630,000
3
Beds
2
Baths
2,205
Sq Ft
$271/Sq Ft
Est. Value
About This Home
This home is located at 2S041 Taylor Rd, Glen Ellyn, IL 60137 and is currently estimated at $597,234, approximately $270 per square foot. 2S041 Taylor Rd is a home located in DuPage County with nearby schools including Westfield Elementary School, Glen Crest Middle School, and Glenbard South High School.
Ownership History
Date
Name
Owned For
Owner Type
Purchase Details
Closed on
Apr 22, 2005
Sold by
Goldstein Howard G and Mcgrath Margaret A
Bought by
Goldstein Howard G and Mcgrath Margaret A
Current Estimated Value
Purchase Details
Closed on
Apr 19, 2004
Sold by
Gransee Sandra K and Eberhardt Kristen L
Bought by
Goldstein Howard G and Mcgrath Margaret A
Home Financials for this Owner
Home Financials are based on the most recent Mortgage that was taken out on this home.
Original Mortgage
$396,000
Interest Rate
4%
Mortgage Type
Purchase Money Mortgage
Purchase Details
Closed on
Sep 24, 2001
Sold by
Downey Glenn P and Downey Sharon E
Bought by
Downey Sharon E
Home Financials for this Owner
Home Financials are based on the most recent Mortgage that was taken out on this home.
Original Mortgage
$171,000
Interest Rate
6%
Create a Home Valuation Report for This Property
The Home Valuation Report is an in-depth analysis detailing your home's value as well as a comparison with similar homes in the area
Home Values in the Area
Average Home Value in this Area
Purchase History
| Date | Buyer | Sale Price | Title Company |
|---|---|---|---|
| Goldstein Howard G | -- | -- | |
| Goldstein Howard G | $396,000 | Burnet Title Llc | |
| Downey Sharon E | -- | Plm Title Company |
Source: Public Records
Mortgage History
| Date | Status | Borrower | Loan Amount |
|---|---|---|---|
| Closed | Goldstein Howard G | $396,000 | |
| Previous Owner | Downey Sharon E | $171,000 |
Source: Public Records
Tax History Compared to Growth
Tax History
| Year | Tax Paid | Tax Assessment Tax Assessment Total Assessment is a certain percentage of the fair market value that is determined by local assessors to be the total taxable value of land and additions on the property. | Land | Improvement |
|---|---|---|---|---|
| 2024 | $8,795 | $154,214 | $27,768 | $126,446 |
| 2023 | $8,305 | $141,950 | $25,560 | $116,390 |
| 2022 | $7,974 | $134,160 | $24,160 | $110,000 |
| 2021 | $7,794 | $130,980 | $23,590 | $107,390 |
| 2020 | $7,852 | $129,760 | $23,370 | $106,390 |
| 2019 | $7,589 | $126,330 | $22,750 | $103,580 |
| 2018 | $6,201 | $103,490 | $21,440 | $82,050 |
| 2017 | $5,630 | $99,670 | $20,650 | $79,020 |
| 2016 | $5,657 | $95,680 | $19,820 | $75,860 |
| 2015 | $5,594 | $91,280 | $18,910 | $72,370 |
| 2014 | $7,111 | $111,480 | $17,600 | $93,880 |
| 2013 | $6,856 | $111,810 | $17,650 | $94,160 |
Source: Public Records
Map
Nearby Homes
- 1S730 Milton Ave
- 2S165 Huntington Ct
- 21W745 Glen Valley Dr
- 1S526 Taylor Rd
- 2S365 Milton Ave
- 217 S Park Blvd
- 22W041 Pinegrove Ct
- 597 Lowden Ave
- 470 Fawell Blvd Unit 510
- 470 Fawell Blvd Unit 320
- 129 Harding Ct
- 131 Harding Ct
- 143 Harding Ct
- 453 Raintree Dr Unit 5E
- 485 Raintree Ct Unit B
- 21W353 Drury Ln
- 2S200 Valley Rd
- 440 Raintree Ct Unit 1D
- 440 Raintree Ct Unit 1M
- 310 Greenbriar Rd Unit 2B
- 2S053 Taylor Rd
- 2S033 Taylor Rd
- 22W072 Stratford Place
- 2S065 Taylor Rd
- 2S040 Taylor Rd
- 22W064 Stratford Place
- 2S019 Taylor Rd
- 2S030 Taylor Rd
- 2S050 Taylor Rd
- 22W071 Stratford Place
- 2S058 Taylor Rd
- 22W031 Taylor Rd
- 2S020 Taylor Rd
- 2S038 Stratford Rd
- 22W054 Stratford Place
- 22W131 22nd St
- 22W040 Taylor Rd
- 22W065 Stratford Place Unit 5
- 2S027 Sheffield Rd
- 2S041 Sheffield Rd