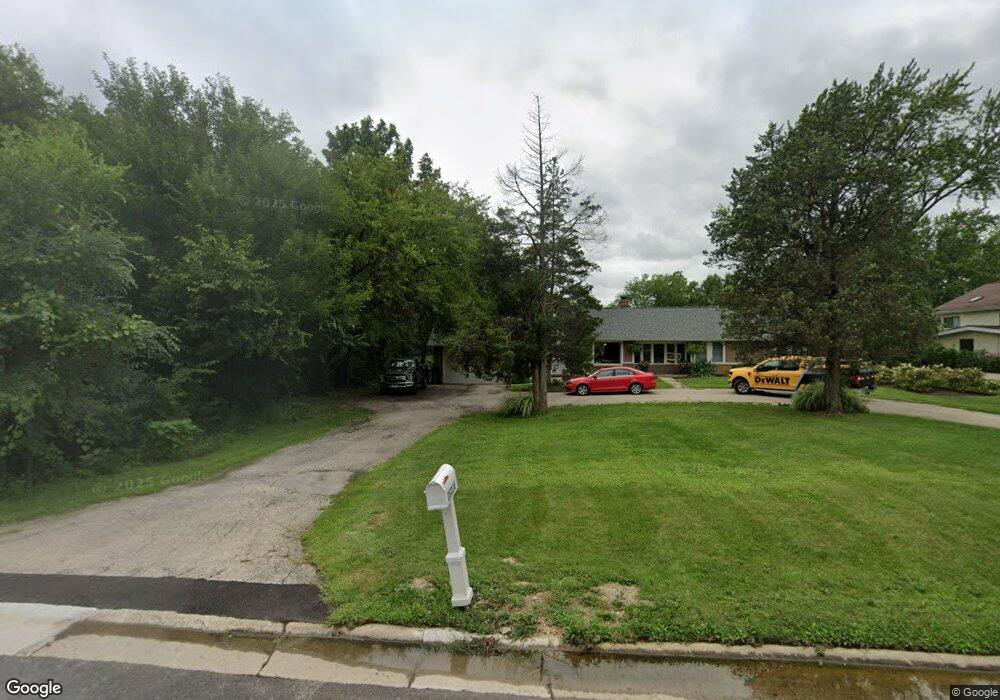
2S216 State Route 59 Warrenville, IL 60555
Estimated Value: $321,054 - $376,000
--
Bed
--
Bath
1,148
Sq Ft
$309/Sq Ft
Est. Value
About This Home
This home is located at 2S216 State Route 59, Warrenville, IL 60555 and is currently estimated at $355,014, approximately $309 per square foot. 2S216 State Route 59 is a home located in DuPage County with nearby schools including Clifford Johnson School, Hubble Middle School, and Wheaton Warrenville South High School.
Ownership History
Date
Name
Owned For
Owner Type
Purchase Details
Closed on
Jan 4, 2010
Sold by
Sharma Ram R
Bought by
Sharma Shakuntala and Sharma Ram R
Current Estimated Value
Purchase Details
Closed on
Jul 6, 2007
Sold by
Arwood Leah and Arwood Charles
Bought by
Arwood Charles and Arwood Leah
Home Financials for this Owner
Home Financials are based on the most recent Mortgage that was taken out on this home.
Original Mortgage
$185,000
Outstanding Balance
$115,147
Interest Rate
6.42%
Mortgage Type
Stand Alone Refi Refinance Of Original Loan
Estimated Equity
$239,867
Purchase Details
Closed on
Oct 23, 2002
Sold by
Sharma Shakuntala
Bought by
Sharma Ram R
Purchase Details
Closed on
Aug 31, 1995
Sold by
Benson James R
Bought by
Clegg Leah and Arwood Charles W
Home Financials for this Owner
Home Financials are based on the most recent Mortgage that was taken out on this home.
Original Mortgage
$125,051
Interest Rate
7.76%
Mortgage Type
FHA
Purchase Details
Closed on
Apr 11, 1994
Sold by
Novak Adeline S
Bought by
Benson James R
Create a Home Valuation Report for This Property
The Home Valuation Report is an in-depth analysis detailing your home's value as well as a comparison with similar homes in the area
Home Values in the Area
Average Home Value in this Area
Purchase History
| Date | Buyer | Sale Price | Title Company |
|---|---|---|---|
| Sharma Shakuntala | -- | Accommodation | |
| Arwood Charles | -- | None Available | |
| Sharma Ram R | -- | -- | |
| Clegg Leah | $126,000 | -- | |
| Benson James R | -- | -- |
Source: Public Records
Mortgage History
| Date | Status | Borrower | Loan Amount |
|---|---|---|---|
| Open | Arwood Charles | $185,000 | |
| Closed | Clegg Leah | $125,051 |
Source: Public Records
Tax History Compared to Growth
Tax History
| Year | Tax Paid | Tax Assessment Tax Assessment Total Assessment is a certain percentage of the fair market value that is determined by local assessors to be the total taxable value of land and additions on the property. | Land | Improvement |
|---|---|---|---|---|
| 2024 | $6,477 | $96,450 | $40,752 | $55,698 |
| 2023 | $6,117 | $88,090 | $37,220 | $50,870 |
| 2022 | $5,878 | $82,330 | $34,780 | $47,550 |
| 2021 | $5,575 | $78,920 | $33,340 | $45,580 |
| 2020 | $5,430 | $76,530 | $32,330 | $44,200 |
| 2019 | $5,178 | $72,880 | $30,790 | $42,090 |
| 2018 | $4,813 | $68,120 | $28,780 | $39,340 |
| 2017 | $4,676 | $64,730 | $27,350 | $37,380 |
| 2016 | $4,487 | $60,350 | $25,500 | $34,850 |
| 2015 | $4,308 | $55,860 | $23,600 | $32,260 |
| 2014 | $4,116 | $52,710 | $22,270 | $30,440 |
| 2013 | $4,146 | $54,630 | $23,080 | $31,550 |
Source: Public Records
Map
Nearby Homes
- 29W715 Branch Ave
- 2S283 Illinois Route 59
- 2S452 Riverside Ave
- 2S030 Essex Ln
- 30W151 Arlington Ct
- 30W274 Bedford Ln
- 2S467 Cherice Dr
- 30W105 Maplewood Dr
- 29W749 Hurlingham Dr
- 30W021 Danbury Dr Unit 2A
- 2S547 Continental Dr
- 2S590 Seraph Holmes Ct
- 2S723 Winchester Cir E Unit 4
- 29W574 Winchester Cir N Unit 1
- 2S739 Winchester Cir E Unit 1
- 2S708 Timber Dr
- 30W073 Penny Ln
- Lot 1 Elizabeth St
- 3S072 Timber Dr Unit 9C
- 30W023 Cedar Ct Unit 23
- 2S204 Rte 59
- 29W701 Branch Ave
- 2S254 Illinois Rte 59
- 2S254 State Route 59
- 2S217 Riverside Ave
- 2S231 Riverside Ave
- 2S205 Riverside Ave
- 2S241 Riverside Ave
- 2S181 Riverside Ave
- 2S255 Riverside Ave
- 2S151 Riverside Ave
- 2S181 State Route 59
- 2S131 Everett Ct
- 2S280 State Route 59
- 2S173 State Route 59
- 2S231 State Route 59
- 2S269 Riverside Ave
- 2S161 State Route 59
- 2S216 Riverside Ave
- 2S130 Everett Ct