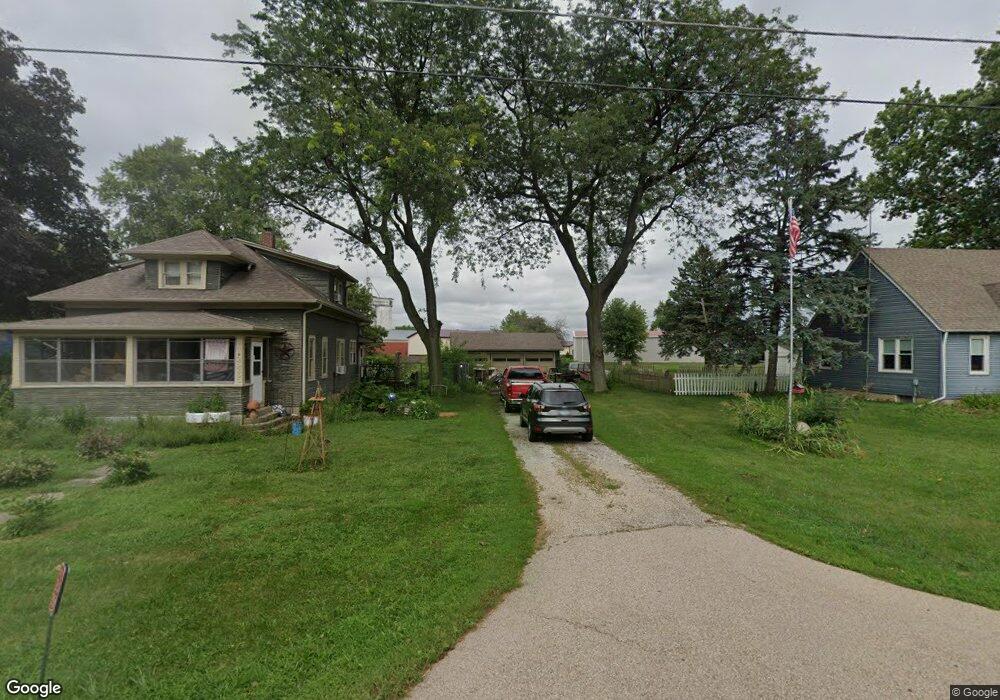
2S251 Harter Rd Elburn, IL 60119
Estimated Value: $267,453 - $307,000
3
Beds
1
Bath
1,482
Sq Ft
$197/Sq Ft
Est. Value
About This Home
This home is located at 2S251 Harter Rd, Elburn, IL 60119 and is currently estimated at $292,363, approximately $197 per square foot. 2S251 Harter Rd is a home with nearby schools including Kaneland Blackberry Creek Elementary School, Harter Middle School, and Kaneland High School.
Ownership History
Date
Name
Owned For
Owner Type
Purchase Details
Closed on
Aug 29, 2016
Sold by
Tin Can Properties Llc
Bought by
Paustian Susan
Current Estimated Value
Home Financials for this Owner
Home Financials are based on the most recent Mortgage that was taken out on this home.
Original Mortgage
$176,735
Outstanding Balance
$141,396
Interest Rate
3.48%
Mortgage Type
FHA
Estimated Equity
$150,967
Purchase Details
Closed on
Nov 26, 2013
Sold by
Heinberg Karen and Nier Myron L
Bought by
Tin Can Properties Llc
Purchase Details
Closed on
Aug 10, 2010
Sold by
Nier Myron L and Nier Lenore S
Bought by
Nier Myron L and Nier Lenore S
Purchase Details
Closed on
Nov 13, 2008
Sold by
Nier Sharon
Bought by
Heinberg Karen and Nier Myron
Purchase Details
Closed on
Jul 1, 1996
Sold by
Nier Doris M
Bought by
Heinberg Karen and Nier Eugene
Create a Home Valuation Report for This Property
The Home Valuation Report is an in-depth analysis detailing your home's value as well as a comparison with similar homes in the area
Home Values in the Area
Average Home Value in this Area
Purchase History
| Date | Buyer | Sale Price | Title Company |
|---|---|---|---|
| Paustian Susan | $188,800 | Chicago Title Insurance Co | |
| Tin Can Properties Llc | $125,000 | Chicago Title Insurance Co | |
| Nier Myron L | -- | None Available | |
| Heinberg Karen | $60,000 | Chicago Title Insurance Co | |
| Heinberg Karen | -- | -- |
Source: Public Records
Mortgage History
| Date | Status | Borrower | Loan Amount |
|---|---|---|---|
| Open | Paustian Susan | $176,735 |
Source: Public Records
Tax History
| Year | Tax Paid | Tax Assessment Tax Assessment Total Assessment is a certain percentage of the fair market value that is determined by local assessors to be the total taxable value of land and additions on the property. | Land | Improvement |
|---|---|---|---|---|
| 2024 | $5,652 | $78,469 | $23,516 | $54,953 |
| 2023 | $5,595 | $73,103 | $21,908 | $51,195 |
| 2022 | $5,387 | $67,030 | $20,088 | $46,942 |
| 2021 | $5,212 | $64,236 | $19,251 | $44,985 |
| 2020 | $5,071 | $62,021 | $18,587 | $43,434 |
| 2019 | $4,956 | $59,544 | $17,845 | $41,699 |
| 2018 | $4,609 | $54,274 | $16,266 | $38,008 |
| 2017 | $4,268 | $49,652 | $14,881 | $34,771 |
| 2016 | $4,558 | $45,228 | $13,555 | $31,673 |
| 2015 | -- | $42,229 | $12,656 | $29,573 |
| 2014 | -- | $42,229 | $12,656 | $29,573 |
| 2013 | -- | $45,535 | $13,647 | $31,888 |
Source: Public Records
Map
Nearby Homes
- 46W524 Locust St
- 44W019 Main Street Rd
- 44W099 Finley Rd
- 2S227 Green Rd
- 0S790 Rowe Rd
- Lot 9 Rowe Rd
- 00 Rt 38 Rd
- 49W615 Lasher Rd
- 48W201 Keslinger Rd
- Lot #11 Derek Dr
- Lot #12 Derek Dr
- Lot #5 Derek Dr
- Lot #6 Derek Dr
- Lot #4 Derek Dr
- Lot #7 Derek Dr
- 0S955 Thorndon Ridge Dr Unit 2
- 16 Derek Dr
- 765 Carolyn Ct
- 1029 Wise St
- 1557 Melbourne St
- 2S243 Harter Rd
- 2S265 Harter Rd
- 2S225 Harter Rd
- 2S225 Harter Rd
- 2S256 Harter Rd
- 2S246 Harter Rd
- 2S273 Harter Rd
- 2S272 Harter Rd
- 2S286 Harter Rd
- 2S222 Harter Rd
- 46W587 Lovell St
- 2S316 Harter Rd
- 2S324 Harter Rd
- 44W773 Harter Rd
- 44W865 Harter Rd
- 44W830 Harter Rd
- 46W620 Locust St
- 2S330 Harter Rd
- 46W640 Locust St
Your Personal Tour Guide
Ask me questions while you tour the home.