2S483 Dauberman Rd Unit 7 Elburn, IL 60119
Estimated Value: $313,000 - $378,000
3
Beds
2
Baths
1,750
Sq Ft
$201/Sq Ft
Est. Value
About This Home
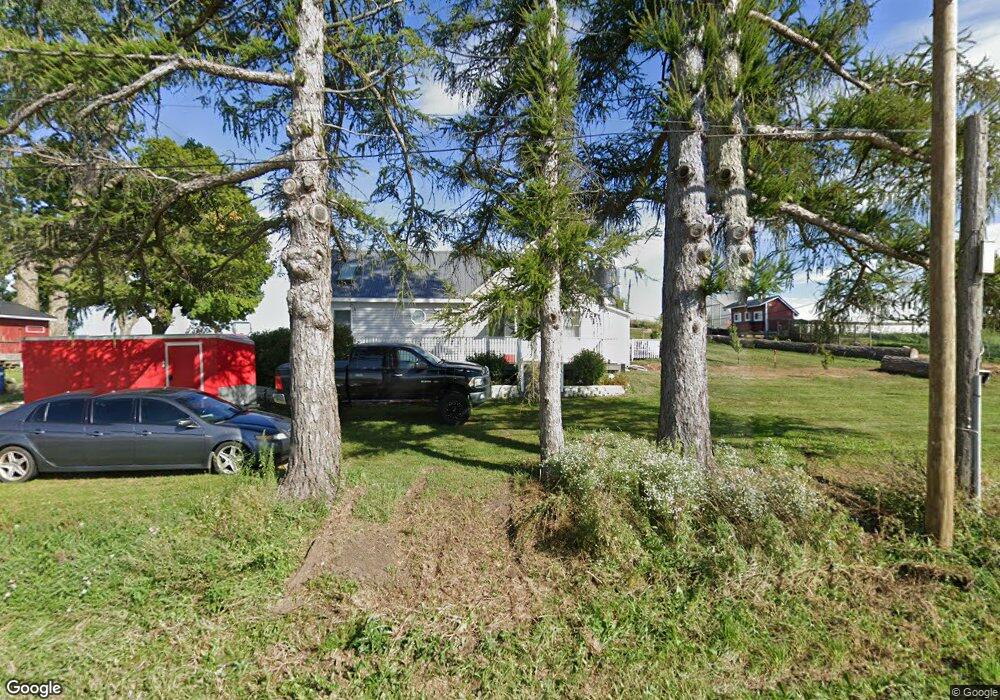
This home is located at 2S483 Dauberman Rd Unit 7, Elburn, IL 60119 and is currently estimated at $351,549, approximately $200 per square foot. 2S483 Dauberman Rd Unit 7 is a home located in Kane County with nearby schools including Kaneland Blackberry Creek Elementary School, Harter Middle School, and Kaneland High School.
Ownership History
Date
Name
Owned For
Owner Type
Purchase Details
Closed on
Mar 22, 2012
Sold by
Pacifica Loan Pool Llc
Bought by
Marek David J
Current Estimated Value
Home Financials for this Owner
Home Financials are based on the most recent Mortgage that was taken out on this home.
Original Mortgage
$80,000
Outstanding Balance
$55,033
Interest Rate
3.9%
Mortgage Type
New Conventional
Estimated Equity
$296,516
Purchase Details
Closed on
Aug 25, 2000
Sold by
Heath Kevin D and Heath Mary C
Bought by
Randall Brad and Randall Margherita
Home Financials for this Owner
Home Financials are based on the most recent Mortgage that was taken out on this home.
Original Mortgage
$179,550
Interest Rate
8.26%
Create a Home Valuation Report for This Property
The Home Valuation Report is an in-depth analysis detailing your home's value as well as a comparison with similar homes in the area
Home Values in the Area
Average Home Value in this Area
Purchase History
| Date | Buyer | Sale Price | Title Company |
|---|---|---|---|
| Marek David J | $140,000 | Fidelity National Title | |
| Randall Brad | $199,500 | First American Title Ins Co |
Source: Public Records
Mortgage History
| Date | Status | Borrower | Loan Amount |
|---|---|---|---|
| Open | Marek David J | $80,000 | |
| Previous Owner | Randall Brad | $179,550 |
Source: Public Records
Tax History
| Year | Tax Paid | Tax Assessment Tax Assessment Total Assessment is a certain percentage of the fair market value that is determined by local assessors to be the total taxable value of land and additions on the property. | Land | Improvement |
|---|---|---|---|---|
| 2024 | $6,998 | $95,250 | $23,516 | $71,734 |
| 2023 | $6,939 | $88,737 | $21,908 | $66,829 |
| 2022 | $6,652 | $81,365 | $20,088 | $61,277 |
| 2021 | $6,441 | $77,974 | $19,251 | $58,723 |
| 2020 | $6,271 | $75,286 | $18,587 | $56,699 |
| 2019 | $6,134 | $72,280 | $17,845 | $54,435 |
| 2018 | $5,718 | $65,883 | $16,266 | $49,617 |
| 2017 | $5,306 | $60,272 | $14,881 | $45,391 |
| 2016 | $4,928 | $54,902 | $13,555 | $41,347 |
| 2015 | -- | $51,262 | $12,656 | $38,606 |
| 2014 | -- | $51,262 | $12,656 | $38,606 |
| 2013 | -- | $55,275 | $13,647 | $41,628 |
Source: Public Records
Map
Nearby Homes
- 46W524 Locust St
- 44W019 Main Street Rd
- 49W615 Lasher Rd
- 44W099 Finley Rd
- 43W690 Marian Cir
- 2S227 Green Rd
- 00 Rt 38 Rd
- 0S790 Rowe Rd
- Lot 9 Rowe Rd
- 48W201 Keslinger Rd
- 0N953 Probst Ct
- Lot #11 Derek Dr
- Lot #12 Derek Dr
- Lot #5 Derek Dr
- Lot #6 Derek Dr
- Lot #4 Derek Dr
- Lot #7 Derek Dr
- 0S955 Thorndon Ridge Dr Unit 2
- 16 Derek Dr
- 660 Avon Ct
- 46W973 Elm St
- 2S432 Cedar Ct
- 2S456 Cedar Ct
- 46W972 Elm St
- 2S461 Cedar Ct
- 46W919 Elm St
- 2S441 Cedar Ct
- 46W916 Elm St
- 2S365 Dauberman Rd
- 0 Dauberman Rd
- 46W897 Elm St
- 2S488 Locust St Unit 7
- 2S460 Locust St
- 2S438 Locust St
- 2S337 Dauberman Rd
- 46W867 Elm St
- 46W900 Elm St Unit 6
- 2S410 Locust St
- 2S315 Dauberman Rd Unit 6
- 46W843 Elm St
Your Personal Tour Guide
Ask me questions while you tour the home.