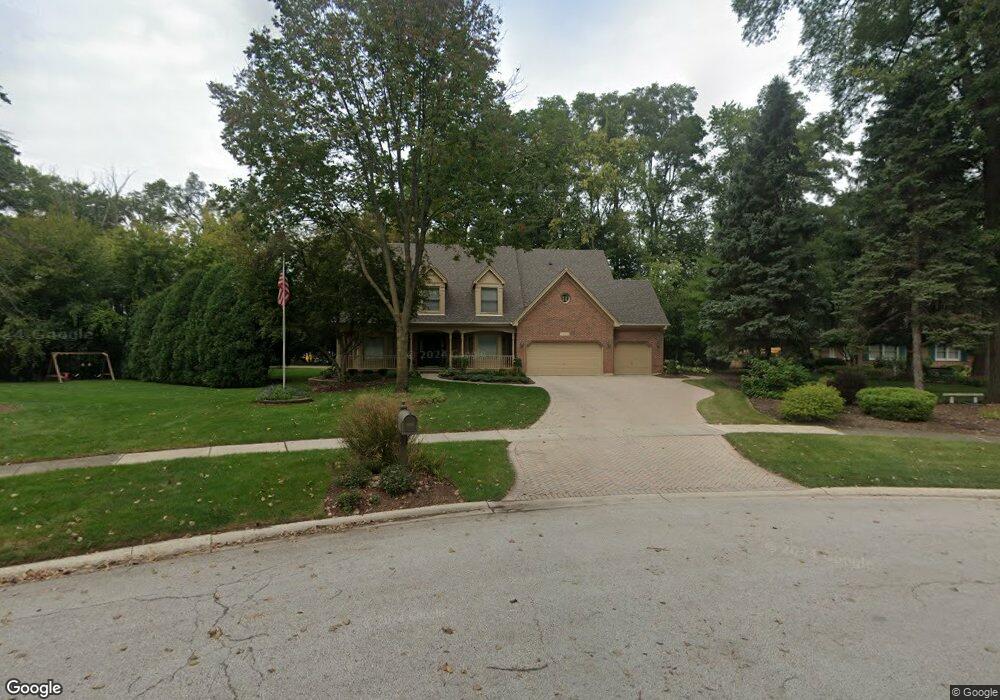
2S610 Cree Ln Wheaton, IL 60189
Arrowhead NeighborhoodEstimated Value: $821,000 - $1,030,000
4
Beds
4
Baths
3,271
Sq Ft
$279/Sq Ft
Est. Value
About This Home
This home is located at 2S610 Cree Ln, Wheaton, IL 60189 and is currently estimated at $913,635, approximately $279 per square foot. 2S610 Cree Ln is a home located in DuPage County with nearby schools including Wiesbrook Elementary School, Hubble Middle School, and Wheaton Warrenville South High School.
Ownership History
Date
Name
Owned For
Owner Type
Purchase Details
Closed on
Jul 17, 2003
Sold by
Wehby Gail A and Wehby Michael A
Bought by
Bulger Terrance J and Bulger Mary L
Current Estimated Value
Home Financials for this Owner
Home Financials are based on the most recent Mortgage that was taken out on this home.
Original Mortgage
$322,700
Interest Rate
5.31%
Mortgage Type
Purchase Money Mortgage
Purchase Details
Closed on
Jun 4, 2002
Sold by
Wehby Michael A and Wehby Gail A
Bought by
Wehby Michael A and Wehby Gail A
Purchase Details
Closed on
Oct 27, 2001
Sold by
Wehby Michael A and Wehby Gail A
Bought by
Wehby Michael A and Wehby Gail A
Purchase Details
Closed on
Mar 15, 2001
Sold by
Wehby Michael A and Wehby Gail A
Bought by
Wehby Michael A and Wehby Gail A
Purchase Details
Closed on
Dec 21, 1996
Sold by
Leblond Peter C and Leblond Jean M
Bought by
Wehby Michael A and Wehby Gail A
Create a Home Valuation Report for This Property
The Home Valuation Report is an in-depth analysis detailing your home's value as well as a comparison with similar homes in the area
Home Values in the Area
Average Home Value in this Area
Purchase History
| Date | Buyer | Sale Price | Title Company |
|---|---|---|---|
| Bulger Terrance J | $770,000 | -- | |
| Wehby Michael A | -- | -- | |
| Wehby Michael A | -- | -- | |
| Wehby Michael A | -- | -- | |
| Wehby Michael A | $1,000 | -- |
Source: Public Records
Mortgage History
| Date | Status | Borrower | Loan Amount |
|---|---|---|---|
| Closed | Bulger Terrance J | $322,700 |
Source: Public Records
Tax History
| Year | Tax Paid | Tax Assessment Tax Assessment Total Assessment is a certain percentage of the fair market value that is determined by local assessors to be the total taxable value of land and additions on the property. | Land | Improvement |
|---|---|---|---|---|
| 2024 | $15,735 | $277,543 | $40,816 | $236,727 |
| 2023 | $15,084 | $255,470 | $37,570 | $217,900 |
| 2022 | $14,578 | $241,430 | $35,500 | $205,930 |
| 2021 | $14,124 | $235,700 | $34,660 | $201,040 |
| 2020 | $13,999 | $233,510 | $34,340 | $199,170 |
| 2019 | $13,644 | $227,340 | $33,430 | $193,910 |
| 2018 | $15,575 | $260,120 | $31,500 | $228,620 |
| 2017 | $15,327 | $250,530 | $30,340 | $220,190 |
| 2016 | $15,142 | $240,530 | $29,130 | $211,400 |
| 2015 | $15,046 | $229,470 | $27,790 | $201,680 |
| 2014 | $14,777 | $221,250 | $26,720 | $194,530 |
| 2013 | $14,336 | $221,910 | $26,800 | $195,110 |
Source: Public Records
Map
Nearby Homes
- 26W055 Cree Ln
- 1605 Burning Trail
- 1612 Stonebridge Trail
- 141 Loretto Ct
- 2552 Weatherbee Ln
- 76 Somerset Cir
- 1127 Hibbard Rd
- 1601 W Wiesbrook Rd
- 1519 Foothill Dr
- 1533 S County Farm Rd Unit 1-4
- 1440 Stonebridge Cir Unit J7
- 1442 Stonebridge Cir Unit I8
- 1462 Stonebridge Cir Unit F10
- 1S728 Shaffner Rd
- 1S710 Shaffner Rd
- 2043 Spring Green Dr
- Lot 1 Foothill Dr
- 30 Danada Dr
- 24 Winners Cup Cir Unit 3
- 1245 Josiah Rd
- 2S630 Cree Ln
- 26W054 Cree Ln
- 26W081 Embden Ln
- 26W065 Embden Ln
- 26W109 Embden Ln
- 2S611 Arrowhead Dr
- 26W044 Cree Ln
- 26W055 Embden Ln
- 2S621 Arrowhead Dr
- 2S642 Cree Ln
- 26W121 Embden Ln
- 2S641 Arrowhead Dr
- 26W043 Embden Ln
- 26W045 Cree Ln
- 26W040 Cree Ln
- 2S650 Cree Ln
- 26W054 Sioux Ct
- 26W140 Arrow Glen Ct
- 26W027 Embden Ln
- 26W141 Arrow Glen Ct
Your Personal Tour Guide
Ask me questions while you tour the home.