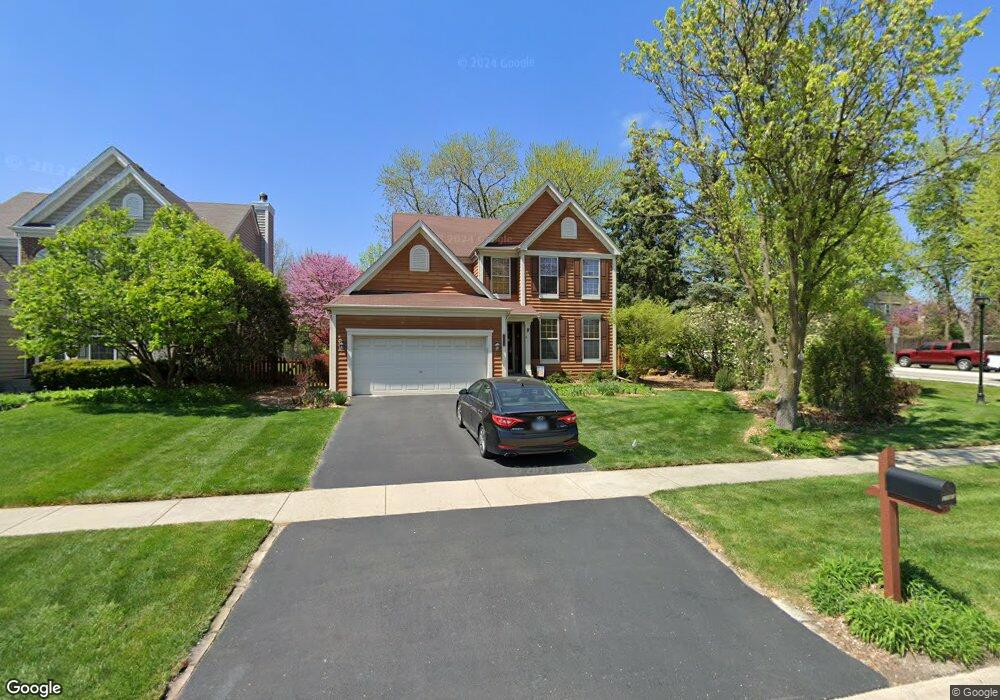
2S665 Westbury Ct Warrenville, IL 60555
Estimated Value: $478,299 - $593,000
--
Bed
--
Bath
2,329
Sq Ft
$230/Sq Ft
Est. Value
About This Home
This home is located at 2S665 Westbury Ct, Warrenville, IL 60555 and is currently estimated at $534,825, approximately $229 per square foot. 2S665 Westbury Ct is a home located in DuPage County with nearby schools including Clifford Johnson School, Hubble Middle School, and Wheaton Warrenville South High School.
Ownership History
Date
Name
Owned For
Owner Type
Purchase Details
Closed on
Aug 5, 2004
Sold by
Borowski Andrew A and Borowski Elizabeth A
Bought by
Coakley John M and Coakley Deborah L
Current Estimated Value
Home Financials for this Owner
Home Financials are based on the most recent Mortgage that was taken out on this home.
Original Mortgage
$272,000
Outstanding Balance
$138,004
Interest Rate
6.35%
Mortgage Type
Purchase Money Mortgage
Estimated Equity
$396,821
Purchase Details
Closed on
Apr 21, 2000
Sold by
Lasalle Bank National Assn
Bought by
Borowski Andrew E and Borowski Elizabeth A
Home Financials for this Owner
Home Financials are based on the most recent Mortgage that was taken out on this home.
Original Mortgage
$217,455
Interest Rate
8.24%
Mortgage Type
Purchase Money Mortgage
Create a Home Valuation Report for This Property
The Home Valuation Report is an in-depth analysis detailing your home's value as well as a comparison with similar homes in the area
Home Values in the Area
Average Home Value in this Area
Purchase History
| Date | Buyer | Sale Price | Title Company |
|---|---|---|---|
| Coakley John M | $340,000 | Ctic | |
| Borowski Andrew E | $272,000 | -- |
Source: Public Records
Mortgage History
| Date | Status | Borrower | Loan Amount |
|---|---|---|---|
| Open | Coakley John M | $272,000 | |
| Previous Owner | Borowski Andrew E | $217,455 | |
| Closed | Coakley John M | $15,000 |
Source: Public Records
Tax History Compared to Growth
Tax History
| Year | Tax Paid | Tax Assessment Tax Assessment Total Assessment is a certain percentage of the fair market value that is determined by local assessors to be the total taxable value of land and additions on the property. | Land | Improvement |
|---|---|---|---|---|
| 2024 | $10,362 | $149,509 | $32,880 | $116,629 |
| 2023 | $9,819 | $136,550 | $30,030 | $106,520 |
| 2022 | $10,052 | $136,540 | $30,020 | $106,520 |
| 2021 | $9,548 | $130,890 | $28,780 | $102,110 |
| 2020 | $9,309 | $126,920 | $27,910 | $99,010 |
| 2019 | $7,924 | $108,350 | $26,580 | $81,770 |
| 2018 | $7,454 | $102,210 | $25,070 | $77,140 |
| 2017 | $7,255 | $97,120 | $23,820 | $73,300 |
| 2016 | $6,979 | $90,550 | $22,210 | $68,340 |
| 2015 | $6,724 | $83,820 | $20,560 | $63,260 |
| 2014 | $6,573 | $80,600 | $19,770 | $60,830 |
| 2013 | $6,612 | $83,550 | $20,490 | $63,060 |
Source: Public Records
Map
Nearby Homes
- 2S708 Timber Dr
- 2S739 Winchester Cir E Unit 1
- 2S723 Winchester Cir E Unit 4
- Lot 1 Elizabeth St
- 2S778 Timber Dr Unit 778
- 3S054 Timber Dr Unit 11A
- 2S749 Grove Ln
- 3S072 Timber Dr Unit 9C
- 29W441 Butternut Ln
- 29W420 Tanglewood Ln
- 29W749 Hurlingham Dr
- 29W101 Morris Ct
- 3S184 Birchwood Dr
- 30W021 Danbury Dr Unit 2A
- 2S283 Illinois Route 59
- 3S268 Twin Pines Dr
- 29W425 Thornwood Ln
- 3S284 Pattermann Rd
- 30W105 Maplewood Dr
- 3S321 Blackthorn Ln
- 2S664 Westbury Ct
- 2S663 Westbury Ct
- 29W433 Batavia Rd
- 2S576 Seraph Holmes Ct
- 2S662 Westbury Ct
- 2S651 Westbury Ct
- 2S652 Westbury Ct
- 2S661 Westbury Ct
- 2S653 Westbury Ct
- 2S654 Westbury Ct
- 2S578 Seraph Holmes Ct
- 2S640 Cerny Rd Unit B4
- 2S640 Cerny Rd Unit A3
- 2S640 Cerny Rd Unit B1
- 2S640 Cerny Rd Unit A1
- 2S640 Cerny Rd Unit B3
- 2S640 Cerny Rd Unit A2
- 2S640 Cerny Rd Unit A4
- 2S640 Cerny Rd Unit B2
- 2S640 Cerny Rd Unit 3A