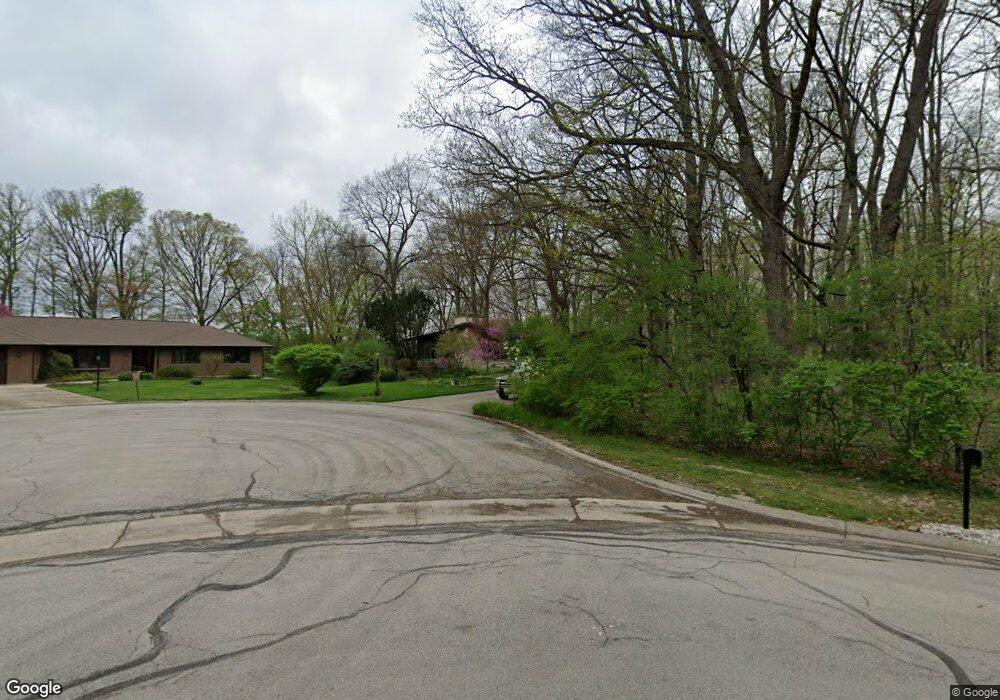
2S956 Thorncrest Rd Batavia, IL 60510
Southeast Batavia NeighborhoodEstimated Value: $389,000 - $472,000
4
Beds
--
Bath
1,830
Sq Ft
$234/Sq Ft
Est. Value
About This Home
This home is located at 2S956 Thorncrest Rd, Batavia, IL 60510 and is currently estimated at $429,025, approximately $234 per square foot. 2S956 Thorncrest Rd is a home located in Kane County with nearby schools including Louise White Elementary School, Sam Rotolo Middle School, and Batavia Sr High School.
Ownership History
Date
Name
Owned For
Owner Type
Purchase Details
Closed on
Oct 11, 1997
Sold by
Lence John W
Bought by
Lence John W and Lence Patrice E
Current Estimated Value
Home Financials for this Owner
Home Financials are based on the most recent Mortgage that was taken out on this home.
Original Mortgage
$95,000
Outstanding Balance
$15,236
Interest Rate
7.43%
Estimated Equity
$413,789
Purchase Details
Closed on
Jun 25, 1997
Sold by
Vandervelde Gerald and Vandervelde Jane A
Bought by
Lence John
Home Financials for this Owner
Home Financials are based on the most recent Mortgage that was taken out on this home.
Original Mortgage
$201,600
Interest Rate
8.01%
Purchase Details
Closed on
Oct 21, 1994
Sold by
Erickson John E and Erickson Mary K
Bought by
Vandervelde Gerald and Vandervelde Jane A
Home Financials for this Owner
Home Financials are based on the most recent Mortgage that was taken out on this home.
Original Mortgage
$187,200
Interest Rate
6.37%
Create a Home Valuation Report for This Property
The Home Valuation Report is an in-depth analysis detailing your home's value as well as a comparison with similar homes in the area
Home Values in the Area
Average Home Value in this Area
Purchase History
| Date | Buyer | Sale Price | Title Company |
|---|---|---|---|
| Lence John W | -- | Chicago Title Insurance Co | |
| Lence John | $252,000 | -- | |
| Vandervelde Gerald | $234,000 | Law Title |
Source: Public Records
Mortgage History
| Date | Status | Borrower | Loan Amount |
|---|---|---|---|
| Open | Lence John W | $95,000 | |
| Previous Owner | Lence John | $201,600 | |
| Previous Owner | Vandervelde Gerald | $187,200 |
Source: Public Records
Tax History
| Year | Tax Paid | Tax Assessment Tax Assessment Total Assessment is a certain percentage of the fair market value that is determined by local assessors to be the total taxable value of land and additions on the property. | Land | Improvement |
|---|---|---|---|---|
| 2024 | $8,459 | $120,777 | $29,290 | $91,487 |
| 2023 | $8,292 | $109,618 | $26,584 | $83,034 |
| 2022 | $8,142 | $102,447 | $24,845 | $77,602 |
| 2021 | $7,474 | $93,656 | $23,563 | $70,093 |
| 2020 | $7,283 | $91,856 | $23,110 | $68,746 |
| 2019 | $7,153 | $88,604 | $22,292 | $66,312 |
| 2018 | $6,862 | $85,229 | $21,443 | $63,786 |
| 2017 | $6,676 | $82,419 | $20,736 | $61,683 |
| 2016 | $7,028 | $80,018 | $20,132 | $59,886 |
| 2015 | -- | $78,196 | $19,674 | $58,522 |
| 2014 | -- | $75,735 | $19,055 | $56,680 |
| 2013 | -- | $80,484 | $24,910 | $55,574 |
Source: Public Records
Map
Nearby Homes
- 239 Durham St
- 243 Durham St
- 1013 Fitzwilliam Way
- 906 Homerton Blvd
- 608 Spyglass Ct
- 1687 Sauk Dr
- 242 Sussex Ln
- 218 Sussex Ct
- 1705 South Ct
- 527 Ridgelawn Trail
- 306 Carrie Ct
- 313 Carrie Ct
- 104 Briar Ln
- 860 S River St
- 724 S Jefferson St
- 200 Linn Ct Unit C
- 320 Sussex Ln
- Lot 4 Manchester Ave
- 404 S Batavia Ave
- 63 Oak Creek Ct
- 35W547 Thorncrest Rd
- 2S943 Shagbark Dr
- 2S942 Thorncrest Rd
- 2S925 Shagbark Dr
- 2S957 Shagbark Dr
- 35W535 Thorncrest Rd
- Lot 28 Shagbark Dr
- 234 Durham St
- 230 Durham St
- 2S908 Thorncrest Rd
- 238 Durham St
- 35W520 Thorncrest Rd
- 35w Thorncrest Rd
- 35W509 Thorncrest Rd
- 226 Durham St
- 28 Shagbark Dr
- 3S427 Banbury Rd
- 3S361 Banbury Rd
- 2 Thorncrest Rd
- 242 Durham St
Your Personal Tour Guide
Ask me questions while you tour the home.