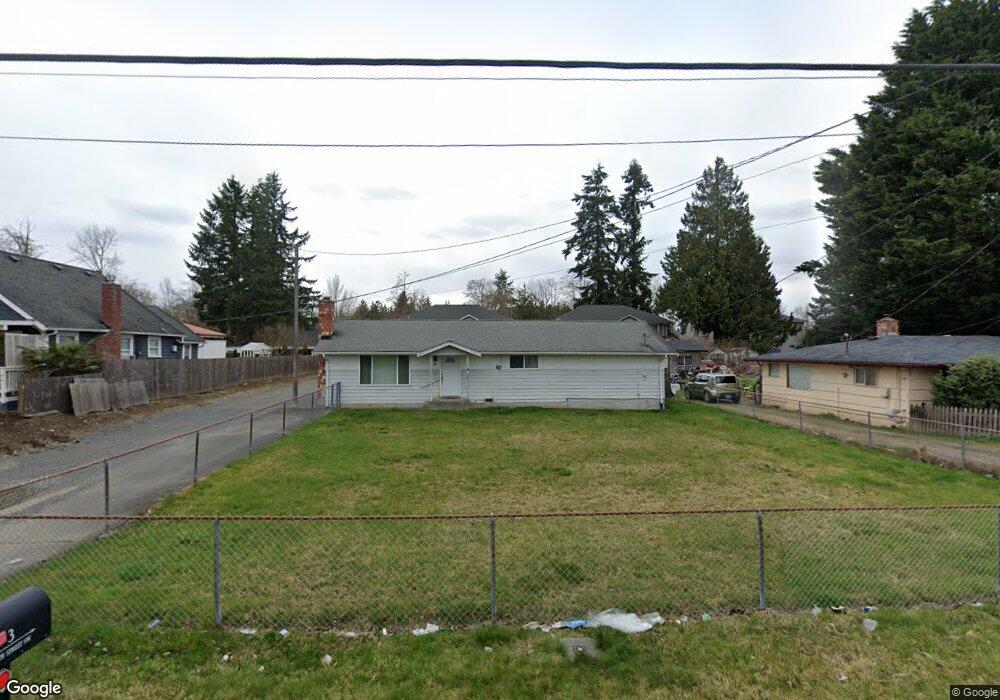
3 107th St SW Everett, WA 98204
Everett Mall South NeighborhoodEstimated Value: $597,261 - $628,000
4
Beds
1
Bath
1,350
Sq Ft
$454/Sq Ft
Est. Value
About This Home
This home is located at 3 107th St SW, Everett, WA 98204 and is currently estimated at $613,565, approximately $454 per square foot. 3 107th St SW is a home located in Snohomish County with nearby schools including Olivia Park Elementary School, Explorer Middle School, and Mariner High School.
Ownership History
Date
Name
Owned For
Owner Type
Purchase Details
Closed on
May 21, 2007
Sold by
Britt Shannon K and Mcfarland Michael Alvin Carr
Bought by
Britt Shannon K
Current Estimated Value
Home Financials for this Owner
Home Financials are based on the most recent Mortgage that was taken out on this home.
Original Mortgage
$220,800
Outstanding Balance
$147,255
Interest Rate
8.5%
Mortgage Type
Stand Alone First
Estimated Equity
$466,310
Purchase Details
Closed on
Jan 5, 2001
Sold by
Plouff Jodi and Plouff Iona
Bought by
Britt Shannon Kay and Mcfarland Michael Alvin Carr
Home Financials for this Owner
Home Financials are based on the most recent Mortgage that was taken out on this home.
Original Mortgage
$159,989
Interest Rate
7.65%
Mortgage Type
FHA
Purchase Details
Closed on
Jan 27, 1999
Sold by
Dubis Don and Dubis Marjorie A
Bought by
Plouff Jodi and Plouff Iona
Home Financials for this Owner
Home Financials are based on the most recent Mortgage that was taken out on this home.
Original Mortgage
$120,000
Interest Rate
6.63%
Create a Home Valuation Report for This Property
The Home Valuation Report is an in-depth analysis detailing your home's value as well as a comparison with similar homes in the area
Home Values in the Area
Average Home Value in this Area
Purchase History
We collect this data history from publicly available records. To have your information removed, we recommend requesting removal directly through your county’s website.
| Date | Buyer | Sale Price | Title Company |
|---|---|---|---|
| Britt Shannon K | $120,551 | Stewart | |
| Britt Shannon Kay | $162,500 | -- | |
| Plouff Jodi | $150,000 | -- |
Source: Public Records
Mortgage History
We collect this data history from publicly available records. To have your information removed, we recommend requesting removal directly through your county’s website.
| Date | Status | Borrower | Loan Amount |
|---|---|---|---|
| Open | Britt Shannon K | $220,800 | |
| Previous Owner | Britt Shannon Kay | $159,989 | |
| Previous Owner | Plouff Jodi | $120,000 |
Source: Public Records
Tax History
| Year | Tax Paid | Tax Assessment Tax Assessment Total Assessment is a certain percentage of the fair market value that is determined by local assessors to be the total taxable value of land and additions on the property. | Land | Improvement |
|---|---|---|---|---|
| 2026 | $4,548 | $551,300 | $399,000 | $152,300 |
| 2025 | $4,336 | $529,000 | $384,000 | $145,000 |
| 2024 | $4,336 | $507,700 | $360,000 | $147,700 |
| 2023 | $4,305 | $526,900 | $375,000 | $151,900 |
| 2022 | $3,790 | $391,100 | $260,000 | $131,100 |
| 2020 | $3,202 | $321,100 | $208,000 | $113,100 |
| 2019 | $2,917 | $292,900 | $180,000 | $112,900 |
| 2018 | $2,909 | $254,700 | $154,000 | $100,700 |
| 2017 | $2,564 | $228,900 | $138,000 | $90,900 |
| 2016 | $2,345 | $207,300 | $120,000 | $87,300 |
| 2015 | $2,401 | $194,600 | $111,000 | $83,600 |
| 2013 | $2,058 | $155,300 | $81,000 | $74,300 |
Source: Public Records
Map
Nearby Homes
- 128 107th St SE
- 225 106th St SW Unit A2
- 2 109th Place SE
- 11013 Meridian Ave S Unit 36
- 420 107th Place SW Unit 2
- 420 107th Place SW Unit 1
- 2 xx 106th St SE
- 11100 4th Ave W Unit 30
- 11100 4th Ave W Unit 22
- 11110 3rd Place SE
- 629 107th Place SW
- 609 108th Place SE
- 11014 6th Ave W Unit B
- 11014 6th Ave W Unit C
- 215 100th St SW Unit B102
- 215 100th St SW Unit D207
- 11414 2nd Ave SE
- 11121 7th Place W Unit D
- 729 112th St SW Unit E1
- 206 W Marilyn Ave
- 5 107th St SE
- 11 107th St SW
- 13 107th St SW
- 9 107th St SE
- 17 107th St SW
- 2 107th St SE
- 15 107th St SE
- 6 107th St SW
- 12 107th St SE
- 10610 1st Dr SE
- 8 107th St SE
- 0 106th St SE
- 21 107th St SW
- 16 107th St SW Unit B
- 16 107th St SW Unit A
- 16 107th St SW Unit A & B
- 16 107th St SW
- 21 107th St SE
- 4 107th St SW
- 4 107th St SE
Your Personal Tour Guide
Ask me questions while you tour the home.